Click here to Skip to main content
15,890,512 members
Everything / Chart

Chart

chart

Great Reads

by Bharat Mallapur
Sample project to host MS-Chart in your WPF application
by Sunasara Imdadhusen
MS Test Result Viewer is a free open source library to convert MS Test result (.trx) file into HTML. It is also allowed you to perform MS Test on your test container project (.dll) file. This utility will work with simple command line arguments to generate test report in HTML format with excellent U
by Angelo Cresta
.NET 5 version of dotnet/winforms-datavisualization
by Xavier John
Candlestick

Latest Articles

by Code Artist
Implementation of DynamicX-Largest-Triangle-Three-Bucket for chart data plotting
by Vishwas_R
Simple Audio Player to browse any song with Play / Pause, Stop options & a waveform generated using CanvasJS charts
by Vishwas_R
Create Angular dynamic chart with few simple steps using CanvasJS. Dynamic charts are also referred to as real-time chart / live chart.
by Angelo Cresta
.NET 5 version of dotnet/winforms-datavisualization

All Articles

Sort by Title

Chart 

4 Sep 2012 by Flux89
Hello guys,when trying to display a bar chart with loooots of bars, the screen space is not enough. However, this wouldnt matter too much If I could at least save the image with a much higher resolution AND more details in it.So far I managed to save the image with a bigger size via:...
12 Jun 2013 by VIP Venkatesan
Hi Friends, Suggest me some Best Chart examples for dot net.. I've worked on with MVC Json Charts,HighCharts very long months ago.. But i've not any idea about charts in aspx. Plz suggest some attractable Charts.Thank u..
12 Jun 2013 by Ahmed Bensaid
ASP.NET 4.0 Chart Control[^]
12 Jun 2013 by Zafar Sultan
I have used This[^]. Fantastic control and free.
2 Mar 2017 by Prain86
Using VisualStudio WindowsForms Form. Creating Chart control in designer.I'm trying to add some customLabels on charts Axis along WITH the default labels.To do so I add customLabels with RowIndex property =1. Thus I see default labels AND my customLabels.Now the problem is that default...
20 Jul 2011 by A.Najafi
Dear All,Recently, I am searching for a library to plot 3d surfaces using array of XYZ data. I spent long time to find it. But, all of useful component arenot free. Is there a free simple 3d library?Thanks Allot.
20 Jul 2011 by Sergey Alexandrovich Kryukov
Yes, WPF, see by yourself is it simple or not. Just one CodeProject article: High performance WPF 3D Chart[^].—SA
13 Jun 2018 by creizlein
I am trying to use the mschart control for WinForms to create a ZXY 3D area graph similar as the one shown in the picture above, but I was not able to find any specific example on how to do it. http://i66.tinypic.com/2cdg9pj.png or https://s33.postimg.cc/3tn1r5kcf/snap0191.png I have checked...
13 Jun 2018 by Ralf Meier
You stuck because the MSChart isn't able do do what you want to have. With the ChartArea\Area3DStyle you can tell the Chart that you like to have different (2D-) Series displayed behind each other - but that isn't the thing you want to have. For this you need another kind of Chart ... Here is a...
26 Mar 2015 by getrelax
I want to make 3D chart with x, y, and z axis in Asp.Net is there any solution for it?
26 Mar 2015 by Sergey Alexandrovich Kryukov
You can start with Web search.—SA
10 Jun 2014 by LucasRLS
I need to implement charts with square grid lines. The pixel value of a delta in X need to be the same as a delta in Y. How do it? this apper to be really simple, but I didn't find exemples in c#. I tried it, but the values do not converge in a chart run time modified... public void...
19 Aug 2014 by LucasRLS
I just need to implement it as a PrePaint. As my program is resizeble, I had to do a similar function to implement at Resize Event. Othe requisite is the required redraw of charts. For that, I must have a stoper, I suggest to use a if condition (Foo.Zoom_). I removed my project info of this...
18 Dec 2013 by Adeel Ijaz
hi, my requirement is to show a scatter chart where images of employees are displyed rather than the points. is there a way to do it. I have tried HTML5 charts with trial version of canvasjs but we can only show images there on the tooltips but hovering on the point. Where as my...
12 May 2014 by AR547
Requirement:I need to create a Stacked Bar Chart in my web application based on 2.0 plateform. I dont want to use any third party tool or chart in VS because I cannot access the chart control when working on 2.0 plateform. It only supports 3.5.Is there any professional developer present...
7 Oct 2013 by VICK
Do have a look on Google API.....Pretty Easy to deploy in an ASP.NET application.. and much helpful in chart creation...https://developers.google.com/chart/interactive/docs/examples[^]Hope it will help... :)
7 Oct 2013 by amnk.info
This is very nice and creative chart control.. try ithttp://docs.fusioncharts.com/charts/contents/guide-for-web-developers/csnet/CS_BasicExample.html[^]
12 Sep 2013 by ♥…ЯҠ…♥
Hi Friends, Am using Google Visualization Column charts in my application.Go to google visual playground and select columnchart and paste the below code you can see the column bar chart​function drawVisualization() { // Create and populate the data table. var data =...
27 Sep 2015 by Member 11999641
Hi, I have many tab panels being created dynamically in tab container based on what the user has selected from a listbox. If user has selected 'item1' and 'item2' from listbox, 2 tab panels will be created with tab ID and header text as 'item1' and 'item2'.I would like to add in chart with...
26 Sep 2015 by Member 11999641
hi, I can create tab panels in tab container dynamically based on options user has selected from Listbox. Let's say there are 4 items in ListBox, 'Item1, Item2, Item3, Item4'. If user selected all 4 items, 4 tab panels will be created in tab container with header text as 'Item1, Item2, Item3,...
23 May 2013 by Rahul K Singh
Hi, I am using System.Windows.Forms.DataVisualization.Charting.Chart to create bar chart on Win form.if number of bar increases, width of bars got shrink. I want to add scroll bar instead of shrinking the bars.
23 May 2013 by Raju2049
Put chart into div tag and in style property of div set width, height and overflow="scroll". It will work for you.
4 Oct 2015 by Member 11999641
hi Members, I have created box plot chart which will be generated dynamically. I am not sure of how I could adjust the height of chartarea of all charts. I tried research online but still could not find a solution to it.This is my codes:Chart Chart1 = new Chart(); ...
4 Oct 2015 by Ralf Meier
Hi,the Size of the ChartArea itself could not set directly. Only the Size of the Chart as a Control of your Form.The ChartArea-Size depends on :- if the Series-Description is displayed (and the Series-Text itself also)- the Font-Size of each Kind of description (Series, Axis etc.)-...
13 Jan 2017 by Roozbeh Amiressami
I am trying to use AjaxControlToolkit line chart but when i browse my page i see only a stroke I did think my code is wrong, so i use sample of that but i see stroke again please help me frinds.this is sample code of that:
29 Sep 2015 by Member 11999641
I am trying to add a heatmap image beside the chart, which is as shown below. I want the heatmap image to be directly beside the chart. Has tried to set the chart height and image height to be the same but it does not work. Chart is generated dynamically out onto the tab panel. (See here:...
29 Sep 2015 by Palash Mondal_
You can just set the display to inline-block for them like:#chart { display: inline-block; }#heatmap { display: inline-block; }where chart & heatmap are ids of the chart & heatmap controls respectively.
10 Dec 2012 by karthikmandadi@gmail.com
HiThis is karthik, what i want is best charting library to build interactive chart applications in android.I came across no of charts but no one suited to my requirement .My requirements are :1 3D Bar charts2. Interactivity 3. price should be below
8 Mar 2013 by Pratik Butani
AchartEngine is one of the best Android Chart Library.Try this tutorial is Best for AchartEngine
5 Apr 2020 by goo hey
im trying to build a candlestick graph using javascript and for my graph to be read correctly i need to convert data(object) to a long array in my code any help with that? google.charts.load('current', {'packages':['corechart']}); ...
3 Jun 2012 by Arunprasath Natarajan
Dear Friends,I want to create a Flow Chart for my module.Can any one suggest for a Online Flow Chart designer site or application.Regards,AP
3 Jun 2012 by kodeLogic
Try https://www.gliffy.com/[^]Note that free usage is temporarily.
10 May 2018 by alexvw
Hi everyone, I was asked to put a number of graphics together for the office, and the "client" has a problem with the rectangles used within the chart's legend. After doing some "research", I came across this MS document: Chart.CustomizeLegend Event...
10 May 2018 by alexvw
Hi there, Please forgive me for not giving you all more time to come up with some ideas; here after, I'll explain what I did to get what I needed and leave all a question I was not able to find anything about. All in all, customizing legend items was not as straight forward as I expected. I...
13 Jun 2018 by alexvw
Hello everyone; I was asked to put together a few graphs for a website, and it all goes smooth on both development and pre-production environments; however, when deployed to production, all we get is a huge nothing. Here's the web.config content (identical except for connection strings): ...
13 Jun 2018 by an0ther1
As per above comments. The issue was related to the database, in this case the Production server was using the wrong credentials. Changing the database connection string in the test environment to point to the production db assists with troubleshooting because it rules out the 2/3 of the...
26 Aug 2013 by praveen_adb
HI All i am binding Jan2013 to Dec 2013 Values for Asp.NET chart control(Line Graph), if there is no value for the month of Aug 2013 line are not joining between Jul2013 to Sep 2013. Can any one tell what is the property i need to set to join points the charts even if...
11 Oct 2015 by KyLim0211
how to open a new window page when user clicked on the graph?Thanks..
11 Oct 2015 by Arasappan
string url = "window_page"; string fullURL = "window.open('" + url + "' );"; ScriptManager.RegisterStartupScript(this, typeof(string), "OPEN_WINDOW", fullURL, true);Improved Solution string fullURL = "window.open(' http://www.google.de '...
11 Oct 2015 by Abhinav S
Window.Open method[^] should help you open a new window.
11 Oct 2015 by Krunal Rohit
On chart click, write this:Response.Write("");Response.Write("window.open('somepage.aspx','_blank')");Response.Write("");-KR
16 Apr 2018 by Member 13782342
Hi everyone hope you are ok i need help for creating asp.net control charts. I need to create two charts. Chart 1 - Stacked column chart I have 3 attributes status, date and saleAmount i need to create the chart to display the values like this x axis( months), y axis saleAmount and point to...
24 Oct 2016 by TheRedEye
I have a situation in a webforms application using the Chart Control where the chart will often display as a broken image, and only sometimes display correctly. This only occurs once I publish the application to the hosting server, it always renders perfectly on my local development environment....
6 Jul 2013 by OmerFarukDincer
Hi friends,i have a chart control in my asp.net page, i retrieve data from database and and bind it to chart control. Now what i want is to get the clicked slice or column of chart's X and Y AXIS value and send it to another page using Session or querystring or whatever. if there is a...
11 Oct 2013 by ASP.NET Community
ASP.net chart control is one of the newly introduced controls to the Visual Studio IDE from Visual Studio 2010 onwards. It is a very powerful, yet
16 Feb 2020 by Sarvesh Kumar Gupta
Hi,I am using ASP.Net Chart control, For that I run an exe and used this @ DotNet page. This is working fine on Local machine or development machine.Then I published the same on my Server, changes made in web.config according to Local system and run the same exe. When I run the application...
16 Jan 2013 by Sarvesh Kumar Gupta
Changes made in web.config
16 Feb 2020 by Member 13236430
I m stuck in the same problem if you have the solution please share it with me
7 Sep 2011 by joe_j
hi,i have some chart controls of .net 4 in a table.is there a way to set the chart width same as the td of the table in which that particular chart resides?this is because, when the screen is a widescreen, the table fills the screen but the charts are in a static smaller widththanksJoe
7 Sep 2011 by Samresh.ss
I am not very sure, but check if the chart is being rendered as an image. Is so, you can put the align="center" property of . That would center the image, but I don't know if we can stretch the image across.
4 Jan 2012 by gani7787
I am using ASP.NET Chart controls.But,the chart controls will not displaying any property.Also, it give error like Type "System.Web.UI.DataVisualization.Charting.Chart" not defined.I have already added the above dll and namespace.But, still getting the above problems.1. chart...
5 Apr 2012 by Landkeeper
check your web.config fileunder system.webserver>handlers add or check if exists path="ChartImg.axd"...
23 Apr 2013 by Arun.Mohandas
I have a page which generates four graphs using the ASP.NET 4.0 charting control and displays them. The charts are created in the code-behind on Page Load and added into a table on the page.My problem is that when the page loads, the first 1 or more graphs (usually just one, but sometimes 2...
30 Nov 2012 by K2SARAH2
i have an asp.net chart which when i update via code behind, i get an ugly flicker. chart is in update panel but still produces flicker. if anyone can provide or direct me to solution, it would be highly appreciated.thksken
5 Dec 2012 by VishwaKL
Use this 2 lines in tag of master page/which page you getting problem it will help to stop flickering page on load,
15 Nov 2010 by Ariful Islam Sabuz
Shows how chart controls are used in ASP.NET MVC
22 Mar 2012 by Rojeh
Hi all,Kindly i have a page and in the page i have two pie charts, (i'm using Jqplot pie chart)i want to display different background color for the 2 charts but it is embeded in the css file!is there any option to use any color?? or to make it transparent?my code:PieTimer[index] =...
22 Mar 2012 by Rojeh
for all who are interested i changed in the js file: jquery.jqplot.min.js the following old: this.background = "#fffdf6" new: this.background = "transparent"
22 Mar 2012 by Rojeh
another way:According to the jqPlot options page (http://www.jqplot.com/docs/files/jqPlotOptions-txt.html) you have a option called grid where you can set all the grid parameters, one of this parameters is background color.grid: { drawGridLines: true, // wether to draw lines...
4 Oct 2012 by ravijain03
In SSRS Report contain textbox name is "Pie Chart" on that text box using visibility show first pie chart & second pie chart hide using display can be toggled by this report item . report item is Textbox8 i.e pie chart textbox.but when export report in excel both pie chart appeared i want to...
10 Jun 2012 by rohit_singhk
Dear Code Project,Is it possible to create Bar Chart and Line combination in asp.net 3.5 Charting Tools..Please suggest ... Rohit Singh
1 Dec 2015 by abhinuc
I have implemented bar chart in D3.js along with line/area/pie/candle. But it stops running, don't able to debug what i am doing wrong... please help I have added bar function... before that it was working Even console is not showing any errors..here is my fiddle : jsfiddle.net/vaqa6s73/8[^]
17 Jul 2013 by salah9
Hello All,I have a asp.net chart which shows employee attendance of present month.I have a dropdown which shows month name, user will select month from dropdown and click on a button.On this button click I want to call Jquery function which will fetch the data from database of selected...
17 Jul 2013 by Nilesh Agniohtri
You can use Highcharts instead of using ASP.NET charts that supports JQuery.Please visit www.highcharts.com
13 Oct 2015 by Member 11999641
hi all,just a quick question, does anyone know how can I format the line of box plot median from the default dotted line to solid line?Thanks.
4 Aug 2022 by Vishwas_R
Simple Audio Player to browse any song with Play / Pause, Stop options & a waveform generated using CanvasJS charts
17 Aug 2012 by Mac12334
Hi all I am trying to build a RangeBar Chart like thing using jquery and HTML5But don't found any good link to build rangebar type of chart which is present in asp.net 4.0 chart control.I searched in google too but didn't get any solution to build Range Bar Chart.Can you Please...
17 Aug 2012 by Prabhakaran Soundarapandian
Have a Look on the below linksLINK1LINK2LINK3LINK4LINK5
4 Sep 2016 by Member 12668075
Hi,Is they any method to make the WPF X-axis label to get align (such as textalignment). I do try to on the code below but it does not yield any positive outcomeOutcome of X-axis label:Hide Copy Code1111 3333 5555 2222 4444 6666Desire outcome of X-axis label:1111...
11 Sep 2018 by Member 12341536
Hi to everybody,i have a little problem,in a c# Point chart the origin (0/0) is at bottom left corner.How can i change it to the upper left corner? Can someone tell me that?Thanks..What I have tried:google, tried different settings
7 Jan 2017 by OriginalGriff
I don't know what environment you are working in, but this is for WinForms:Highlight the Chart in your form.In the properties pane, Find the "CHart Areas" property, and use the ellipsis to open the properties dialog.In the Chart Area, select the "Axes" collection on the right hand side,...
23 Aug 2014 by Farhan Qureshi
Hi alli am creating a chart in c# and it's showing me two X axis label one with even interval and another with odd intervalhere is my code chartxy.Series.Clear(); chartxy.Titles.Clear(); chartxy.ChartAreas[0].AxisX.Interval =...
8 Jun 2021 by Ken Guru
Hi, today I suddenly stumbled upon a problem. The format "ddd. dd.MM.yyyy" (and others) of the LabelStyle format of the chart was suddenly displayed completely wrong. Further investigation revealed that the representation is correct in a debug...
6 Jun 2016 by Phil Burlison
Trying to implement a simple line chart in C# (2013) that applies a series of negative to positive values on both the X and Y axis. However the chart does not accept the negative Series points for the X axis. The -100 to +100 values are properly displayed on the X axis, but the -50 "Y" value...
6 Jun 2016 by Phil Burlison
Found the problem. Changed the code as follows for (int n = -50; n
16 Apr 2012 by trucha13657
Hi.I have chart implemented in C#, and want to know how to focus chart on 1 point? I mean i want that point to be still in the middle of chart:If u dont understand what i mean, check img:http://www.fotoszok.pl/upload/f7269578.png[^]Thank you! ;-)
16 Apr 2012 by Sergey Alexandrovich Kryukov
I have no idea what charting library do you use, but this problem is solved by… little thinking.Basically, it can be as simple as a simple translation of coordinate system (a shift by constant value). Or maybe a combination of translation with dilation or scaling (you did not explain...
18 Jun 2012 by trucha13657
Still need help.The thing is that:http://i50.tinypic.com/2aakcwj.png[^]There is points with very little values (-2,000e-10... etc).So when ill add there points with values (10,10), (20,20), (30,30) its look like that:http://i50.tinypic.com/28kiygz.png[^]So basically i want...
10 Apr 2014 by FarhanShariff
I have a chart it looks like this http://imgur.com/XoeCnvOI want to change Y axis numbering and label it 1% 10% 33.% etc as shown below with out changing the plot.How do I change itRequired output graph:http://imgur.com/fJ6bQzk
15 Apr 2014 by FarhanShariff
CustomLabel label1 = new CustomLabel { FromPosition = y1,//position on axis. ToPosition = y2, Text = "Y%"//value desired };
21 May 2012 by Member 8956437
Hello,Im trying to configure a Chart in C# but i keep getting this error Message :"The variable name as already been declared. Variable names must be unique within a query batch or a storage procedure."I tried to change the varible name and that message keeps...
21 May 2012 by Leonardo Paneque
oh you can't do that on queries in a datasource in .netyou can only write queries like "select ...." "delete...." etc.but you can not declare stuff like that, if you need it, will have to do it using an stored procedure and select the output from the stored proc.
6 Mar 2019 by Member 10696161
I'm trying create column chart from datagridview which downloads DataSet from database. Is datagridview 2. I've written in public class void loaddata(). As for as chart is concert i wrote by chart() public void class. I want display: XvalueMember : ORDER_NUMBER YvalueMember: TOTAL_TIME There...
6 Mar 2019 by #realJSOP
The very first thing you must do is performa parameterized query. What that means is creating an array of SqlParameter objects, and passing them to the SqlCommand object. Finally, you can replace all of the hard coded values with the appropriate parameter names, something like this: ...
27 Jan 2015 by zimmersm
Greetings. This has been bugging me for hours! I am creating a excel chart object from data in cells.Data looks like this:Time | Temp22:35:22 | 5022:35:23 | 6022:35:24 | 7022:35:25 | 6522:35:26 | 5522:35:27 | 4522:35:28 | 5022:35:29 | 5522:35:30 | 6522:35:31 |...
29 Jan 2015 by JonPeltier
Include both columns in the range that you pass to SetSourceData, and make sure the top left cell is blank (remove the "Time" label). Excel will parse the range the way you want, so you don't need to specify X or Y values.
29 Jan 2015 by JonPeltier
Weird about leaving the entire first row blank. Those (except for the first column) should be used as series names (legend entries) in the chart.Maybe now with the axis code gone, you could try again with only the first cell blank.
1 Nov 2010 by Nik Boatright
I am doing a health monitoring project for school and i need help making a chart with multiple series.My data set is formatted as follows:Date of sample, Time sample is taken, Heart rate for that time frame, Distance traveled in that time frame^ those are the columns and there are...
5 Nov 2010 by Indivara
"Clueless" is rather broad, so I'm not sure of your C# abilities.Does this help?http://csharp.net-informations.com/excel/csharp-excel-chart.ht[^]If you need more details on each class and method given there, go to http://msdn.microsoft.com/library[^]and search there.
12 Dec 2012 by Neema Derakhshan
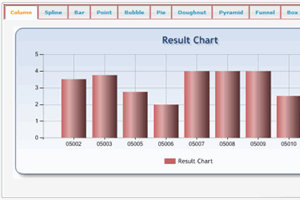
Hello friendsI create a live excel column chart with C# and I need to Bold some custom value-lines with C# too,but I don't how..for example I have these values(y-axis)(vertical) [0,1,2,3,4,5,6,7,8,9,10] and I want horizontal bold lines for 5 , 7 valuessorry for my poor English
11 Dec 2012 by ashokmmrk
Hi,Check thishttp://bytesofcode.hubpages.com/hub/Export-DataSet-and-DataTable-to-Excel-2007-in-CExport Excel File for C#[^]
11 Dec 2012 by sisir patro
Hi Neema,Check these links these may help you too...1. How to make the header font bold while exporting dataset to excel2. Export DataTable to Excel with Formatting in C#Thanks
11 Dec 2012 by sisir patro
Hi Neema,Check these links.These may help you too...1. How to make the header font bold while exporting dataset to excel2. Export DataTable to Excel with Formatting in C#Thanks
22 Dec 2012 by Neema Derakhshan
Hello friendsI'm trying to automate an excel file within a chart,and I want to export the chart to JPG file or something like this,but I got this error : Exception from HRESULT: 0x800401A8I searched hours and tried many codes but every time I get the same error.here is my...
22 Dec 2012 by ChrisTopherus
I did not had a situation like that but i coded a lot on the interopthing. in a lot of situations, my solution was to programmatically call the vba codemodule via:Microsoft.Vbe.Interop;hope this helps...
4 Mar 2018 by Gerry Schmitz
Use 2 threads: One for "capturing" the data; another for "plotting" that reads the "captured" data (from an array or list). Easier to design, build and test (independently). Use a timer to plot; 100ms is "responsive".
4 Mar 2018 by Member 11588285
Hi. I have written a C# application. the program contains a thread that receive some data from UDP socket protocol (each 5 ms) and plot them on four c# charts! when this thread starts, the program starts consuming high memory and cpu usage unfortunately! What I have tried: if i use...
11 Sep 2015 by pgmr_64804
C# Gantt Chart For Winforms
10 Jul 2014 by Ehouarn Perret
Is there anybody here who has already successfully tried a charting library supporting Data Virtualization (like the Virtual Mode in for the DataGridView but for the Chart...)?Seems people think that redrawing everything with an external scrollbar is enough but to me a partial redrawing...
16 Feb 2022 by John Bon Jovy
I'm trying to output some data to the chart. Values that will be plotted are around 10000. The thing is, that without scaling, the difference in several hundred points looks like nothing, and it's impossible to see the difference between...