
Implementation Downsampling Algorithm in MSChart Extension
5.00/5 (3 votes)
Implementation of DynamicX-Largest-Triangle-Three-Bucket for chart data plotting
Introduction
Throughout the years of development, MSChart Extension for WinForms application's performance issue on displaying large data size still remains unsolved. When refreshing a chart on application, we want it to draw as fast as possible to minimize user waiting time and minimize memory consumption. When working with Microsoft Chart Control (MSChart) in WinForms, the amount of memory used and time to draw a chart gets longer with increased data size. FastLine series have better performance but still suffer from performance hit when data size grows beyond 100K data points.
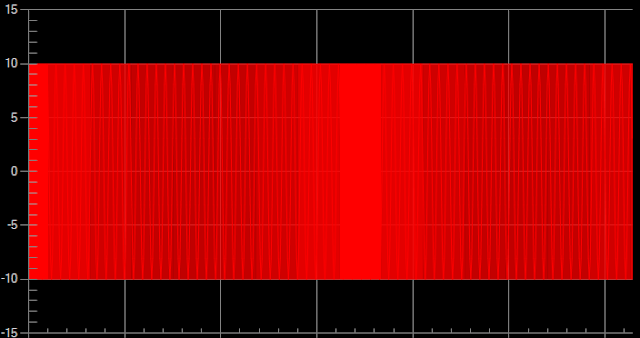
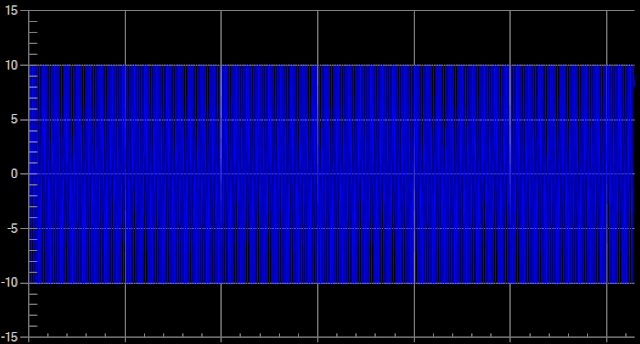
Moreover, plotting large data points on screen with limited pixels caused all the data points and lines to be overlapped, resulting in misinterpretation of information to user. The example below shows sinewave with constant frequency of 100K data points compared to downsampled chart with 500 data points.
About Largest-Triangle-Three-Bucket (LTTB) Algorithm
It's clear that we need some sort of downsampling strategy to plot just enough data points on screen to gain better speed while preserving the peak and trough of the waveforms. It's important to remember that the downsampled data is only meant for data visualization purpose, not for quantitative analysis.
In MSChart Extension, we decided to implement the Largest-Triangle-Three-Bucket (LTTB) algorithm described by Sveinn Steinarsson in his Master Thesis. The complete thesis and implementation on different program language is available in Sveinn Steinarsson GitHub page. Implementation in MSChartExtension is based on C# code by Adrian Seeley.
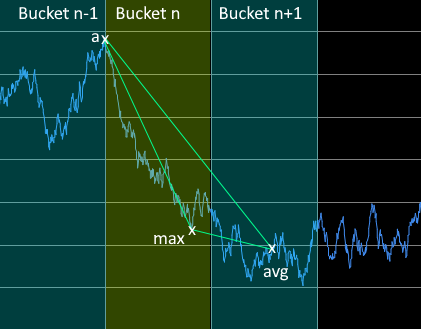
The algorithm works with three buckets at a time and proceeds from left to right of divided buckets to select one point with largest effective area to represent each bucket in the downsampled data. The example below shows random data series with 5000 data points and downsampled of the identical series to 500 data points.


For each point of the selected bucket n, the triangular area for each point is calculated with point a and avg, where point a is the selected point from the previous bucket, while point avg is a temporary point from next bucket ahead. Data point which has the largest area from bucket n will be selected.
The algorithm is implemented as follows, with window[x] being the selected points from each bucket.
We made further optimization in code with multiplication of 0.5 removed since there is no influence on point selected between calculate using triangle area and square area.
    double max_area = double.MinValue;
    for (int n = bucket_start; n < bucket_end; n++)
    {
        // Calculate triangle area over three buckets
        double area = Math.Abs((a_x - avg_x) *
                      (array[n].Y - a_y) - (a_x - n) * (avg_y - a_y));
        if (area > max_area)
        {
            max_area = area;
            max_area_point = array[n];
            next_a = n; // Next a is this b
        }
    }
    // Pick this point from the Bucket
    window[w++] = max_area_point;
DynamicX-Largest-Triangle-Three-Bucket (DLTTB) Algorithm
If you follow Sveinn Steinarsson's thesis and GitHub page, you shall be aware that the LTTB have the following limitation.
- Does not support gaps (
nullvalues) in the data array. - X-values must be in a strictly increasing order.
We decided to take one step beyond to address the limitation described in the original LTTB algorithm.
Instead of dividing the data points into buckets by data index, the improved DyanmicX-Largest-Triangle-Three-Bucket (DLTTB) algorithm divides and groups data points into each bucket with fixed X interval. The number of data points in each bucket might vary depending on the data. A bucket might have no data if none of the data point x values fall between the boundary of the bucket.
   while (array[start].X < bucketBoundary) { start++; }
    bucketBoundary += bucketSizeX;
    end = start;
    if (end <= (array.Length - 1)) //Prevent buffer overrun
    {
        while (array[end].X < bucketBoundary)
        {
            end++;
            if (end == array.Length) break;
        }
    }
Bucket with zero data point will not be plotted while downsampled data for other buckets will be calculated based on LTTB algorithm. Taking into consideration that some of the buckets might be empty, the downsampled data from DLTTB algorithm might have data points less than the defined display data size.
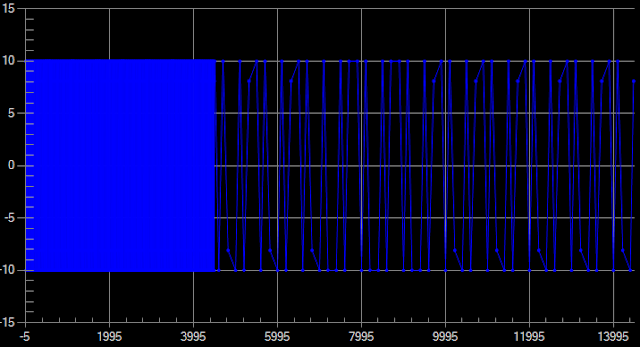
The example below shows 5000 data points of sinewave with 2 different intervals where first 4500 data have x increased by 1, while the last 500 data points have x increased by 20. Look at the amount of data in the first 4500 data points which are painted as solid block.

The image below shows downsampled original data to 800 data point with LTTB algorithm. The last 500 data points look ugly and lose important details since LTTB is not aware of different X interval in the data.
The next image shows downsampled series to 800 data points with DLTTB algorithm which looks better.

The performance of DLTTB and LTTB is identical as both algorithms used single pass method without involving complex multiplication calculation.
Implementation In MSChart Extension
LTTB and DLTTB algorithm are implemented in DownSampling class in MSChartExtension. Setting dynamicX between true (DLTTB) and false (LTTB) to select different algorithm. A new option named BufferedMode is introduced in ChartOption class.
To use buffered mode, first enable BufferedMode and set DisplayDataSize in ChartOption when calling method EnableZoomAndPanControls as shown below:
new ChartOption()
{
    ...
    BufferedMode = true,
    DisplayDataSize = 800
    ...
});
Next, add data points to series using the following extension method for Series class.
series.AddXYBuffered( xvalue, yvalue);
With buffered mode, maximum data points to display on chart is defined in DisplayDataSize properties. When user zoomed in the chart, number of visible data on scale view will be re-evaluated. Downsampling algorithm will take effect if number of visible data is more than twice that of defined display data size. Otherwise, all visible data will be plotted. With such, details of the data will made available to user when zoomed in. First and last point of the series is always plotted to ensure the PAN function works correctly.
Future Update
Future update and changes are made available to the public in GitHub - MSChartExtension project.
History
- 22nd October, 2023: Initial version