
ManhattanPlot
4.40/5 (4 votes)
Manhattan plot in VisualBasic, application of the cross platform VisualBasic in the data science
Manhattan plot in VisualBasic, application of the cross platform VisualBasic in the data science area.
For start the further development, install the Microsoft VisualBasic CLI runtime first:
PM> Install-Package VB_AppFramework
and then add reference to the dll files:
- Microsoft.VisualBasic.Architecture.Framework_v3.0_22.0.76.201__8da45dcd8060cc9a.dll
- Microsoft.VisualBasic.DocumentFormat.Csv.dll
Manhattan plot
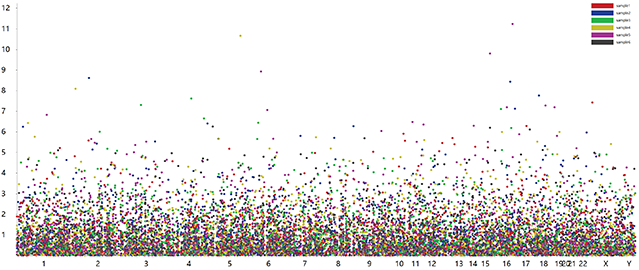
A Manhattan plot is a type of scatter plot, usually used to display data with a large number of data-points - many of non-zero amplitude, and with a distribution of higher-magnitude values, for instance in genome-wide association studies (GWAS).[1] In GWAS Manhattan plots, genomic coordinates are displayed along the X-axis, with the negative logarithm of the association P-value for each single nucleotide polymorphism (SNP) displayed on the Y-axis, meaning that each dot on the Manhattan plot signifies a SNP. Because the strongest associations have the smallest P-values (e.g., 10−15), their negative logarithms will be the greatest (e.g., 15).
It gains its name from the similarity of such a plot to the Manhattan skyline: a profile of skyscrapers towering above the lower level "buildings" which vary around a lower height.
References
- Gibson, Greg (2010). "Hints of hidden heritability in GWAS". Nature Genetics. 42 (7): 558–560. doi:10.1038/ng0710-558. PMID 20581876.
Using the code
First, peeks of the test data. By using sampleTest.R script for generates the test data set.
# 生成测试数据集

size <- 5000

Chr = sample(1:24,size,replace=T)
Position = sample(1:247249719,size)

sample1 = runif(size)
sample2 = runif(size)
sample3 = runif(size)
sample4 = runif(size)
sample5 = runif(size)
sample6 = runif(size)

df <- data.frame(Chr, Position, sample1, sample2, sample3, sample4, sample5, sample6)

write.csv(df, "./manhattan_plot_test.csv")
df <- read.csv("./manhattan_plot_test.csv")
head(df)
#   X Chr  Position   sample1    sample2   sample3     sample4    sample5   sample6
# 1 1   2  22304208 0.4507433 0.01808137 0.5331228 0.886314430 0.05588127 0.9862486
# 2 2   4 230231679 0.6635587 0.27899222 0.9481844 0.531249994 0.21041159 0.3363624
# 3 3  10 143893892 0.1996261 0.48332127 0.2450963 0.361027239 0.52686846 0.8066759
# 4 4  16 132975412 0.8251777 0.20714878 0.8853197 0.940708435 0.13193652 0.1899054
# 5 5   5  40889369 0.1213144 0.26543908 0.5174160 0.003453829 0.25054001 0.8672608
# 6 6  17   7449617 0.1840310 0.10817737 0.2458615 0.570825707 0.38563234 0.1185492
And then load data into memory by using code
Imports Microsoft.VisualBasic.DocumentFormat.Csv

Dim data As SNP() = "./manhattan_plot_test.csv".LoadCsv(Of SNP)
Canvas drawing of the Manhattan Plot is super easy by using just one function:
Canvas.Plot(System.Collections.Generic.IEnumerable(Of ManhattanPlot.SNP), Integer, Integer, System.Collections.Generic.Dictionary(Of String, String), System.Drawing.Size, Integer, Boolean, Boolean, Boolean, String, String) As System.Drawing.Bitmap
Color patterns
Save image method extension required of imports namespace:
Imports Microsoft.VisualBasic.Imaging
Dim image As Bitmap = data.Plot(colorPattern:="chr")
Call image.SaveAs("./manhattan_plot_test.png", ImageFormats.Png)

Dim image As Bitmap = data.Plot(colorPattern:="sampleName")
Call image.SaveAs("./manhattan_plot_test_sampleName.png", ImageFormats.Png)
Dim image As Bitmap = data.Plot(colorPattern:="interval")
Call image.SaveAs("./manhattan_plot_test_interval.png", ImageFormats.Png)

Test on Linux
This program have been test successfully on the Ubuntu Linux system and Windows10, here is the test script example that you can found in the demo Resources folder:
#!/bin/bash

rm ./manhattan_plot_test_chr.png
rm ./manhattan_plot_test_interval.png
rm ./manhattan_plot_test_SampleName.png

../ManhattanPlot.exe /Draw /in "./manhattan_plot_test.csv" /pt.size 10 /sampleColors "./SampleColors.csv" /colorpattern SampleName
../ManhattanPlot.exe /Draw /in "./manhattan_plot_test.csv" /pt.size 10 /colorpattern chr
../ManhattanPlot.exe /Draw /in "./manhattan_plot_test.csv" /pt.size 10 /colorpattern interval
