
Reporting Services for iPhone, Android and all other devices
0/5 (0 vote)
Reports are a critical part of any application that collects or displays data. Users are rarely satisfied with simple lists; they demand rich formatting, charts and interactivity.
Introduction
Reports are a critical part of any application that collects or displays data. Users are rarely satisfied with simple lists; they demand rich formatting, charts and interactivity. They also want to save the reports to their device and subscribe to them so they can track the information without going into the application. When they get the reports in email they still want them to be interactive and update in real-time from wherever they are.
In the 13 years since we released SQL Server Reporting Services (SSRS), technology has kept evolving. Now, HTML5, MVC and mobile are ‘must have’ requirements. Customers are demanding modern applications that support all devices and work fluidly without reloading the entire page. SSRS is a very powerful reporting engine but the Report Viewer control does not support MVC applications and is still an HTML4 WebForms control. It also does not support modern devices (iPhone, Android) and browsers (Chrome, Firefox, and Safari) consistently. So what do you do if you already have 100s of SSRS reports or need reporting in your modern application?
The answer is, you can either rewrite all of your reports with another technology that provides less functionality, or write your own HTML5 Viewer Control and test it with all browsers and devices. Many developers have written SSRS Viewer controls. It is a lot of work, especially if you want to support all of the functionality in Reporting Services. The problem with this approach is that while this was sufficient for other technologies like SilverLight and WPF that can leverage the image renderer, this approach does not work with HTML5. Embedding the tremendously complex SSRS HTML4 output, and embedded script, within an HTML5 application simply does not work. So in addition to writing an HTML5 report viewer control you also have to write an HTML5 interactive renderer. Those of you ambitious enough to have looked at the rendering API know that this is the most complicated API in Reporting Services.
The Solution
Since I led the team that designed and implemented Reporting Services, I am intimately familiar with all of its power and complexity. I used this experience to create Forerunner Software Mobilizer. Mobilizer is a set of HTML5, jQuery widgets and server code that does everything you need to easily embed SSRS reports into your modern application. It has been fully tested on all browsers and devices and has a completely documented JavaScript API. Mobilizer also includes a complete End User application that you can use standalone, on top of any version of SSRS (2008+), without any additional development. As an HTML5 application it is also very customizable by simply modifying the CSS files.
In addition to supporting all SSRS functionality on all browsers and devices, we have added many enhancements to improve the experience including:

- Optimized UI for Smartphones and Tablets
- Responsive report re-layout based on device size
- Thumbnail renderer
- JSON renderer
- Per user default parameters
- Parameter filters (type ahead)
- Managed parameter sets
- Per user favorites and Recent reports view
- Forms Authentication, in addition Integrated Windows authentication
- Significant performance enhancements including page and report caching on the client
- Many more features coming including:
- End-user subscriptions
- Hierarchical parameters
- Dashboards
- …

Architecture
To provide the most natural MVC and HTML5 application development experience we built Mobilizer using MVC API controllers, JSON, and REST APIs.

On the server, we convert the SSRS SOAP API into a JSON based API with the Forerunner.SQLReporting DLL. We then have simple MVC API controllers that map the methods to a REST API. On the client we have a set of jQuery widgets that allow you to easily attach the report to any HTML element and call any of the widget methods. All the CSS files are also included so you can stylize the widgets to match your style. In this way, Mobilizer can easily be integrated into your site.
To add the Mobilizer SDK to your project you just need to:
- Copy the Forerunner DLLs to your bin folder
- Copy the Forerunner folder into your project (default location is the root, but can be anywhere)
- Add the ReportViewer and ReportManager controllers from the sdk folder to your project
- Modify your WebApiConfig.cs file to add a custom API route for the Mobilizer controllers
There is a full getting started sample that explains all the steps in detail.
Getting Started
We have a growing list of samples that include all of the source code to get you started. Mobilizer comes with several widgets that you can put together in any layout you want or use our default template. The widgets include:
- Toolbar – Toolbar widget with all of the default buttons, API to remove and add custom buttons
- Tool Pane – Tool pane widget with all of the default buttons, API to remove and add custom buttons
- ReportViewer – Report viewer widget with all of the methods and events to control the viewer experience
- ReportRender – The render widget that creates the actual report from the RDL
- ReportPamameter – Provides support for all of the parameter functionality
- PageNav – Provides the page navigation UI
- ReportDocumentMap – Provides the document map UI
- ReportExplorer – This widget navigates the SSRS folder hierarchy
- ReportViewerEZ – The viewer EZ widget provides the default template layout for all the viewer widgets
- ReportExplorerEZ - The explorer EZ widget provides the default template layout for all the explorer widgets
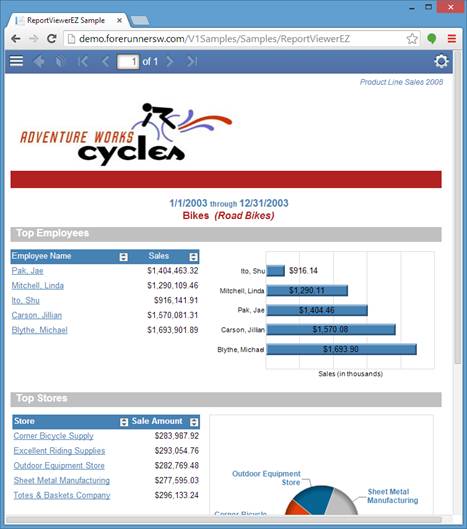
Using the widgets, it is only a couple of lines of code to add reports to your application. To have the report viewer take over the entire body of your page and use the default layout template, like below, you only need 3 of lines of code.
First you need to create the ReportViewerEZ widget. To create a widget in jQuery you call its constructor on the HTML element you want it attached to. In this case we want it on the body object because we are taking over the entire page. It is also convenient to keep a pointer to the widget for later calls.
var $reportViewerEZ = $('body').reportViewerEZ();
After creating the ReportViewerEZ widget on the body we then need to tell it what report we want to display. To do this we need to get the ReportViewer widget from the ReportViewerEZ and call load report.
var $reportViewer = $reportViewerEZ.reportViewerEZ("getReportViewer");
$reportViewer.reportViewer("loadReport","/AdventureWorks 2008 Sample Reports/Product Line Sales 2008"
@{
    ViewBag.Title = "ReportViewerEZ Sample";
    Layout = "../Shared/_SamplesLayout.cshtml";
}

@section scripts {
<script>
  $(document).ready(function () {
    // Create the reportViewerEZ widget and hold onto a reference
    var $reportViewerEZ = $('body').reportViewerEZ();

    // Get the reportViewer widget from reportViewerEZ and load the report
    var $reportViewer = $reportViewerEZ.reportViewerEZ("getReportViewer");
$reportViewer.reportViewer("loadReport","/AdventureWorks 2008 Sample Reports/Product Line Sales 2008"
    );
  });
</script>
}
If you want to build a dashboard-like page with multiple reports in different areas you simply need to create the supporting HTML layout and load the reports exactly like we did above, except with isFullScreen set to false. To create this layout, with two reports on the top and one on the bottom, we use a table with 2 rows and 2 columns. We set the colspan for the second row to 2. We also need to set the size of the report area. You can either set a min size as we have done in this example, so that the reports can grow as necessary, or set a fixed size and get scroll bars.

@{
    ViewBag.Title = "Dashboard Sample";
    Layout = "../Shared/_SamplesLayout.cshtml";
}

@section styles {
// Setup your Styles
  <style>
    body { background-color: rgb(210, 223, 237); }

    .report-container { box-shadow: 0 0 7px #545454; margin: 4px 4px 4px 4px; background-color: white; position:relative; }

    #Report1 { min-width:543px; min-height:500px; }
    #Report2 { min-width:543px; min-height:500px; }
    #Report3 { min-width:1096px; min-height:406px; }
  </style>
}

<script>

//Attach the viewer to your HTML elements with the reports you want.
  $(document).ready(function () {
var $reportViewerEZ1 = $('#Report1').reportViewerEZ({isFullScreen: false});
    var $reportViewer1 = $reportViewerEZ1.reportViewerEZ("getReportViewer");
    $reportViewer1.reportViewer("loadReport", "/Northwind Test Suite/SalesByCountry");

    var $reportViewerEZ2 = $('#Report2').reportViewerEZ({isFullScreen: false});
    var $reportViewer2 = $reportViewerEZ2.reportViewerEZ("getReportViewer");
    $reportViewer2.reportViewer("loadReport", "/Northwind Test Suite/SalesByYear");

    var $reportViewerEZ3 = $('#Report3').reportViewerEZ({isFullScreen: false});
    var $reportViewer3 = $reportViewerEZ3.reportViewerEZ("getReportViewer");
    $reportViewer3.reportViewer("loadReport", "/Northwind Test Suite/SalesByEmployee");
  });
</script>

//Define your HTML layout
<h1>This is a Dashboard sample showing 3 reports on a page</h1>
<table>
    <tr>
        <td>
            <div id="Report1" class="report-container" />
        </td>
        <td>
            <div id="Report2" class="report-container" />
        </td>
    </tr>
    <tr>
        <td colspan="2">
            <div id="Report3" class="report-container" />
        </td>
    </tr>
</table>
Using the explorer widget is just as easy. Like with the full page report viewer example we will use the body to host our widget and keep a pointer to use later.
var $container = $('body');
$container.reportExplorerEZ();
Then we just need to load the root folder.
$container.reportExplorerEZ("transitionToReportManager", "/", null);

@{
    ViewBag.Title = "ReportExplorerEZ Sample";
    Layout = "../Shared/_SamplesLayout.cshtml";
}

@section scripts {
<script>
    $(function () {
        // This sample is full page so the container will be the body
        var $container = $('body');

        // Create the report explorer widget
        $(document).ready(function () {
            $container.reportExplorerEZ();

            // Transition to the home catalog view
            $container.reportExplorerEZ("transitionToReportManager", "/", null);
        });
    })  // function ()
</script>
}
Next Steps
We do not charge extra to develop and test your applications. We provide a 30 day fully functional FREE trial, and with every production license you get free development and test licenses.
- Download Mobilizer today!
- Check out our Demo Server
- Watch our Demo Video
- Review our Development Resources
- Review the Samples
Connect with us!
- www.facebook.com/ForerunnerSoftware
- www.twitter.com/ForerunnerSW
- www.linkedin.com/company/forerunner-software
- www.Forerunnersw.com