
Sammon Projection
4.94/5 (32 votes)
Sammon's projection is a nonlinear projection method to map a high dimensional space onto a space of lower dimensionality.
Introduction
The objective of exploratory data analysis is to produce simplified descriptions and summaries of large data sets. Clustering is one standard method, another alternative way is to project the high-dimensional data sets as points to a low-dimensional - usually 2D - display. Thus the purpose of the projection is to reduce the dimensionality of the data vectors. The projection represents the input data items in a lowerdimensional space in such a way that the clusters and the metric relations of the data items are preserved as faithfully as possible.
Use for the Sammon's Projection
The main use for the projection is visualization. Sammon's projection is useful for preliminary analysis in all statistical pattern recognition, because a rough visualization of the class distribution can be obtained, especially the overlap of the classes.
Personally I use it mainly as a first step in data analysis followed by examining with Self Organizing maps. So it's possible to "cross-verify" the results.
Note 1: Due to the projection process, a new data item can't be mapped to the right position in the image and therefore the projection has to be recomputed for every new data item. This is because there's no mathematical way to describe the position of the new vector.
Note 2: As in any other statistical analysis, it might be useful to normalize the data. A common normalization technique is the so called (0,1)-normalization which normalizes each attribute such that its mean becomes 0 and the variance 1. This is achieved by subtracting the mean and dividing by the variance.
Background
2-dimensional and 3-dimensional data can be easily displayed, e.g. by a scatter plot. 4-dimensional data could be displayed as 3-dimensional scatter-plot whereas the size of the points corresponds to the fourth dimension. When coming to higher dimensionality, we have to find other solutions. Here I'll show the Sammon's projection as a widely used variant for a nonlinear projection and belongs to the metric multidimensional scaling methods. The Sammon's mapping (a.k.a. Sammon's projection) tries to match the pairwise distances of the lower-dimensional projections (representations) of the data items with their original distances. Therefore we have to define a metric which is used by the algorithm.
Metric
Assume we have a metric space and two vectors,

then the general definition of a distance is the so called Minkowski-metric which is defined as:

Most commonly, the Euclidean metric is used (lambda := 2):

or the Manhattan metric (also called City-Block metric, lambda := 1):

The Manhattan metric is computationally less heavy compared to the Euclidean distance and therefore in this article, the Manhattan metric is used.
Projection Algorithm
Suppose a finite set of vectorial samples {xi} and let dij = d(xi,xj) be the defined distance between xi and xj. Let ri be the location of the image of xi on the display (hyper-) plane. The principle is then to place the locations ri, i=1,2,...,n onto the plane in such a way that all their mutual distances ||ri - rj|| are as closely as possible to the distance of the corresponding vectors in the input space.
Projection Error
In order to quantive the "goodness" of the projection, Sammon states a cost function which is labelled as Sammon's stress in the literature.

Minimizing the Projection Error
Thus the projection aims to minimize this function and the projection problem can be seen as a function minimizing problem which can't be solved in a closed form and can only be made approximately. For these kind of problems, several (iterative) algorithms exists:
- Gradient descent
- Genetic algorithms
- Simulated annealing
- Particle swarm optimization
- Other heuristic approaches
Sammon [Sam69] supposes a steepest-descent iterative process which can be written in component form as:

Whereas alpha in (9) is the so called "magic factor" and is found completely experimentally to attain a value of 0.3 to 0.4. Although this is a strict mathematical derivation, it has some drawbacks. When any distance becomes 0, the algorithm fails on behalf of a division to zero. Furthermore the formula seems to be computational heavy. During my test, the results yielded by this approach didn't satisfy me. Kohonen [Koh01] provides a heuristic that works reasonably well and is quite easy to implement. The corrections of the display vectors are defined as follows:

Here 0 < lambda < 1 can be made to decrease monotonically to zero during the process. For an acceptable statistical accuracy, the number of corrections should be in the magnitude of 10e4 to 10e5 times the number of samples. My tests showed that after about 10 iterations, the final positions are occupied and the further iterations are fine-tuning of these locations. Clearly this depends on the dataset on the reduction of lambda where I've chosen an exponential decay.
Implementation
For the Sammon's projection, two classes are provided. The first computes the projection and the second creates the image for the display.
Projection
Manhattan Distance
internal static double ManhattenDistance(double[] vec1, double[] vec2)
{
	double distance = 0;

	for (int i = 0; i < vec1.Length; i++)
		distance += Math.Abs(vec1[i] - vec2[i]);

	return distance;
}
Fisher-Yates-Shuffle
In order to pick the vectors randomly, I quite often use an index-array that is shuffled. The shuffling is done by the Fisher-Yates-Shuffle algorithm:
internal static void FisherYatesShuffle
Distance Matrix
During the iterations of the algorithm, the distances in the input space don't change and therefore these distances are precalculated and stored in a distance matrix. Although this matrix is symmetric and the diagonal elements are 0, the full matrix is stored. On one side, memory isn't a big issue on modern computers and on the other side, the "lookup" can be performed in such a way that the elements of the matrix are in contiguous order thus being faster than the two indirections needed if storing as reduced triangular matrix.
The elements of the distance matrix are computed as follows:
private double[][] CalculateDistanceMatrix()
{
	double[][] distanceMatrix = new double[this.Count][];
	double[][] inputData = this.InputData;

	for (int i = 0; i < distanceMatrix.Length; i++)
	{
		double[] distances = new double[this.Count];
		distanceMatrix[i] = distances;

		double[] inputI = inputData[i];

		for (int j = 0; j < distances.Length; j++)
		{
			if (j == i)
			{
				distances[j] = 0;
				continue;
			}

			distances[j] = Helper.ManhattenDistance(
				inputI,
				inputData[j]);
		}
	}

	return distanceMatrix;
}
The Heuristic Algorithm
The heart of the projection algorithm is shown below:
public void Iterate()
{
	int[] indicesI = _indicesI;
	int[] indicesJ = _indicesJ;
	double[][] distanceMatrix = _distanceMatrix;
	double[][] projection = this.Projection;

	// Shuffle the indices-array for random pick of the points:
	indicesI.FisherYatesShuffle();
	indicesJ.FisherYatesShuffle();

	for (int i = 0; i < indicesI.Length; i++)
	{
		double[] distancesI = distanceMatrix[indicesI[i]];
		double[] projectionI = projection[indicesI[i]];

		for (int j = 0; j < indicesJ.Length; j++)
		{
			if (indicesI[i] == indicesJ[j])
				continue;

			double[] projectionJ = projection[indicesJ[j]];

			double dij = distancesI[indicesJ[j]];
			double Dij = Helper.ManhattenDistance(
					projectionI,
					projectionJ);

			// Avoid division by zero:
			if (Dij == 0)
				Dij = 1e-10;

			double delta = _lambda * (dij - Dij) / Dij;

			for (int k = 0; k < projectionJ.Length; k++)
			{
				double correction =
					delta * (projectionI[k] - projectionJ[k]);

				projectionI[k] += correction;
				projectionJ[k] -= correction;
			}
		}
	}

	// Reduce lambda monotonically:
	ReduceLambda();
}
Image
The image is created by GDI+ and the points of the projection are scaled into the ranges of the resulting image and plot. The color-code and the label foreach point can be provided thus allowing a more "speaking" image.
public Bitmap CreateImage(
	int width,
	int height,
	string[] labels,
	Color[] colors)
{
	if (labels != null && labels.Length != _sammon.Count)
		throw new ArgumentException();

	if (colors != null && colors.Length != _sammon.Count)
		throw new ArgumentException();
	//-----------------------------------------------------------------
	Bitmap bmp = new Bitmap(width, height);

	double minX = _sammon.Projection.Min(p => p[0]);
	double maxX = _sammon.Projection.Max(p => p[0]);
	double minY = _sammon.Projection.Min(p => p[1]);
	double maxY = _sammon.Projection.Max(p => p[1]);

	double ratioX = (width - 20) / (maxX - minX);
	double ratioY = (height - 20) / (maxY - minY);

	Brush brush = new SolidBrush(Color.Black);
	using (Graphics g = Graphics.FromImage(bmp))
	using (Font font = new Font("Arial", _fontSize))
	using (StringFormat format = new StringFormat())
	{
		g.Clear(_backGroundColor);

		format.Alignment = StringAlignment.Center;

		double[][] projection = _sammon.Projection;
		for (int i = 0; i < projection.Length; i++)
		{
			double[] projectionI = projection[i];
			double x = projectionI[0];
			double y = projectionI[1];

			x = (x - minX) * ratioX + 10;
			y = (y - minY) * ratioY + 10;

			if (colors != null)
			{
				brush.Dispose();
				brush = new SolidBrush(colors[i]);
			}

			g.FillEllipse(
				brush,
				(float)(x - _pointSize / 2d),
				(float)(y - _pointSize / 2d),
				_pointSize,
				_pointSize);

			if (labels != null)
			{
				var size = g.MeasureString(labels[i], font);

				g.DrawString(
					labels[i],
					font,
					brush,
					(float)(x - _pointSize / 2d),
					(float)(y - _pointSize / 2d - size.Height),
					format);
			}
		}
	}

	brush.Dispose();

	return bmp;
}
Example and Usage
Data Set
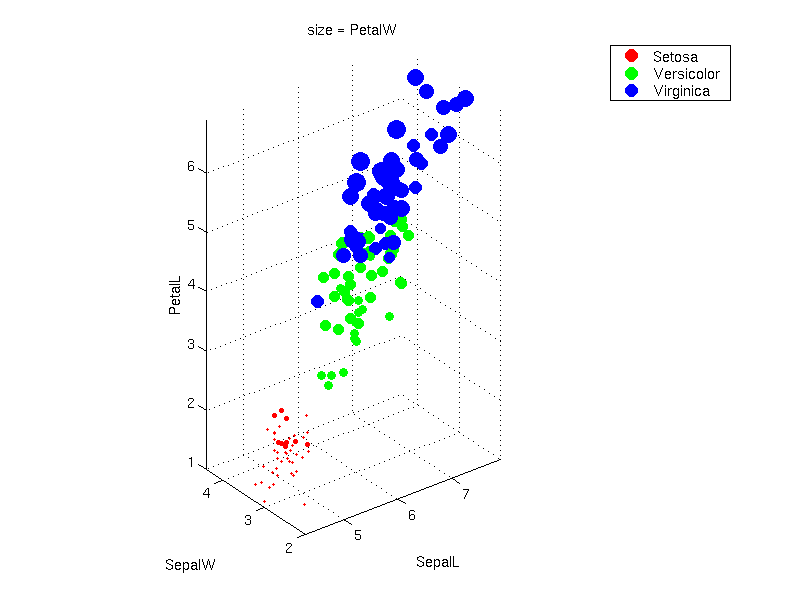
The example provided shows the projection of the famous iris data set from Fisher and can be obtained from UCI's machine learning repository.
The 4-dimensional data set contains 3 classes of 50 instances each, where each class refers to a type of iris plant. One class is linearly separable from the other 2; the latter are NOT linearly separable from each other.
The next image shows a scatter plot of the data set whereas the fourth dimension is used as size of the marker (source: SOM-Pak, University of Helsinki):
Usage of the Classes
The usage is quite simple. After the data is read in (in the example done with the StreamReader), the image for the projection can be computed:
private Bitmap CreateProjection()
{
	SammonsProjection projection = new SammonsProjection(
		_inputData,
		2,
		1000);
	projection.CreateMapping();

	// Create colors and labels - here a lazy version is shown, it should
	// be read from the data set in real applications ;)
	Color[] color = new Color[150];
	string[] labels = new string[150];
	for (int i = 0; i < 50; i++)
	{
		color[i] = Color.Red;
		labels[i] = "set";
	}
	for (int i = 50; i < 100; i++)
	{
		color[i] = Color.Green;
		labels[i] = "vers";
	}
	for (int i = 100; i < 150; i++)
	{
		color[i] = Color.Blue;
		labels[i] = "virg";
	}

	SammonsProjectionPostProcess processing = new SammonsProjectionPostProcess(
		projection);
	processing.PointSize = 4;
	processing.FontSize = 8;
	return processing.CreateImage(300, 300, labels, color);
}
Results
The image for the projection of the iris data set is given below:

Note: Due to random initialization, the image might be different for several runs.
Shown below is a sequence of images taken during the iterations:
|
|
Iteration 0 |
|
|
Iteration 1 |
|
|
Iteration 10 |


It can be seen that the final position of the image vectors are obtained in the first iterations. Note: The series of images is taken from another run than the final image shown above.
References
- [Koh01] T. Kohonen. Self Organizing Maps. Springer, 3 edition, 2001
- [Sam69] J. W. Sammon jr. A Nonlinear Mapping for Data Structure Analysis. IEEE Transactions on Computers, vol. C-18, no. 5, pp 401-409, May 1969
History
- 20th October 2009: Added additional information in the Introduction section
- 18th October 2009: Initial release