
Simple MVC profiler
4.00/5 (2 votes)
Download source files - 323 Kb Introduction. Background Using the code Screenshot About the Author Introduction. Frequently we need to find bottlenecks in MVC View Pages, but there is no proper free tool ,specially when we need to find problem in View...
Introduction.
Frequently we need to find bottlenecks in MVC View Pages, but there is no proper free tool , specially when we need to find problem in View markup full of C# Dynamic anonymous functions. I decided to write simple profiler , which can be used to perform simple performance monitor tasks.This is no comprehended and powerful tool, but is very light and simple to use.
Background
To check the performance of MVC Application we can just put points (Calls of special function) in our code, both in c# code and MVC ViewPage markup as Dynamic anonymous function. Profiler calculates period passed between function calls , and finally outputs all the information in a table.You can easily find slow functions of Your code.
Using the code
An Idea is very simple.If we need to check the performance we put an AddEvent function call of static Profiler class.
It stores each point at List as an instance of ProfilerEvent class and
when we want to output profiler results ,
we put call to ProfilerEvents static function in proper place of ViewPage markup.
AddEvent function has two parameters: first is function Name ,and second is comment.Both names are optional. I use c# 4.0 optional parameters feature to fulfill this function.In MVC View Page Dynamic code blocks we should use distinct name , but in ordinary named functions we can omit this parameter , because Profiler can extract the function name automatically.
Below are two examples of profile using.First is AddEvent function call from Action
and the second is call from Viewpage markup as Dynamic code block.First point is placed at Action function ,
which happened before Dynamic code call ,so we can trace how much time passed between Action call and Dynamic code block.
         public ActionResult Index()
        {
            //Here we place point in MVC Action c# code:
            MVCProfiler.Profiler.AddEvent();
            SampleClass sc = new SampleClass();
            return View(sc.SomeSlowCalculations());
        }

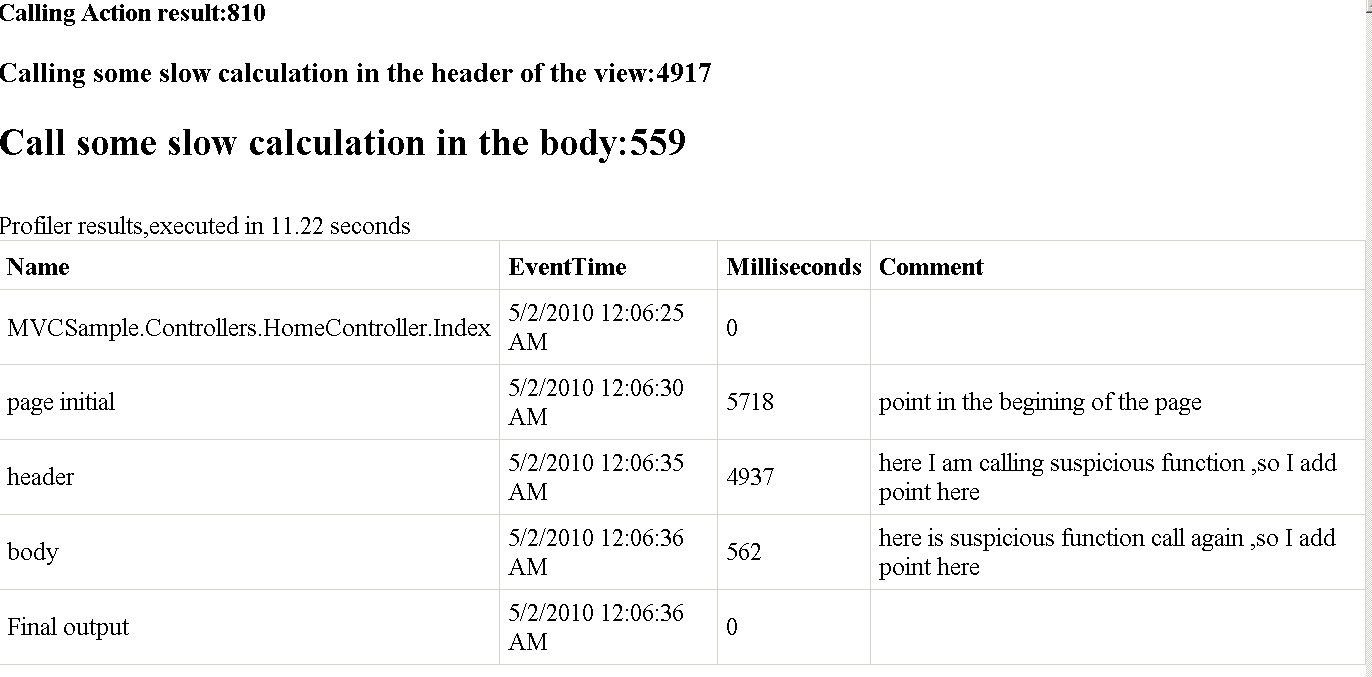
Screenshot
The screenshot below shows the result of using the Profiler
About the Author
Software developer from Tbilisi ,Georgia. Coding in c# from 2002 ,before c# I worked with Delphi.Hope this tip will help You.