
Analyzing Syslog Files Can Be Easy...
4.50/5 (4 votes)
Analyzing Syslog files can be easy...
Introduction
Syslog is a standard for computer message logging. It permits separation of the software that generates messages from the system that stores them and the software that reports and analyzes them.
Syslog can be used for computer system management and security auditing as well as generalized informational, analysis, and debugging messages. It is supported by a wide variety of devices (like printers and routers) and receivers across multiple platforms. Because of this, syslog can be used to integrate log data from many different types of systems into a central repository.
Messages are labeled with a facility code (one of: auth, authpriv, daemon, cron, ftp, lpr, kern, mail, news, syslog, user, uucp, local0 ... local7) indicating the type of software that generated the messages, and are assigned a severity (one of: Emergency, Alert, Critical, Error, Warning, Notice, Info, Debug).
Implementations are available for many operating systems. Specific configuration may permit directing messages to various devices (console), files (/var/log/) or remote syslog servers.
http://en.wikipedia.org/w/index.php?title=Syslog&oldid=610450199
Reading in syslog files is easy, a lot of script languages provides means to do that.
But is it also possible to perform a quick analysis request with these languages?
I'm using ANKHOR FlowSheet for this job.
ANKHOR FlowSheet is a so called 'Data Workbench'. An application for in-memory processing of data from diverse sources and in variable data formats. You can model applications, reports and data services, and perform ad-hoc analysis of datasets.
They offer a 'Community Edition' which is free to use, even for commercial projects.In the attached file, you will find the FlowSheet (SyslogReader.flsx) and the compressed Syslog file (Syslog_100K_Lines.zip).
The graphical construction method is based on the principle of dataflow graphs. It's certainly hard to describe the 'feeling' when you are working with your data. The FlowSheets get executed all the time in the background, which means that you have instant access to the results or the errors in the dataflow. The results of an operator function can immediately be inspected at the 'outputs'. If the resulting tables, strings, pictures are too big, you will get only a subset.
I'm using the FlowSheet application as a permanent tool-builder for my mostly C++ based development tasks. Transforming data, verifying results, log analyzer, content / report creators, all kinds of stuff.
Let's get started.
Your task: Extract the IP addresses out of the text portion and get the access count of every single address.
Dedicated Time: None. Your boss stands behind you...
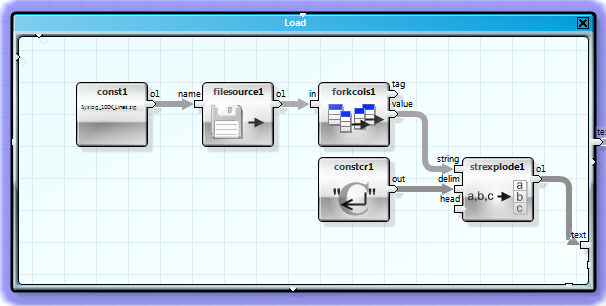
The whole solution, only a handful of operators.
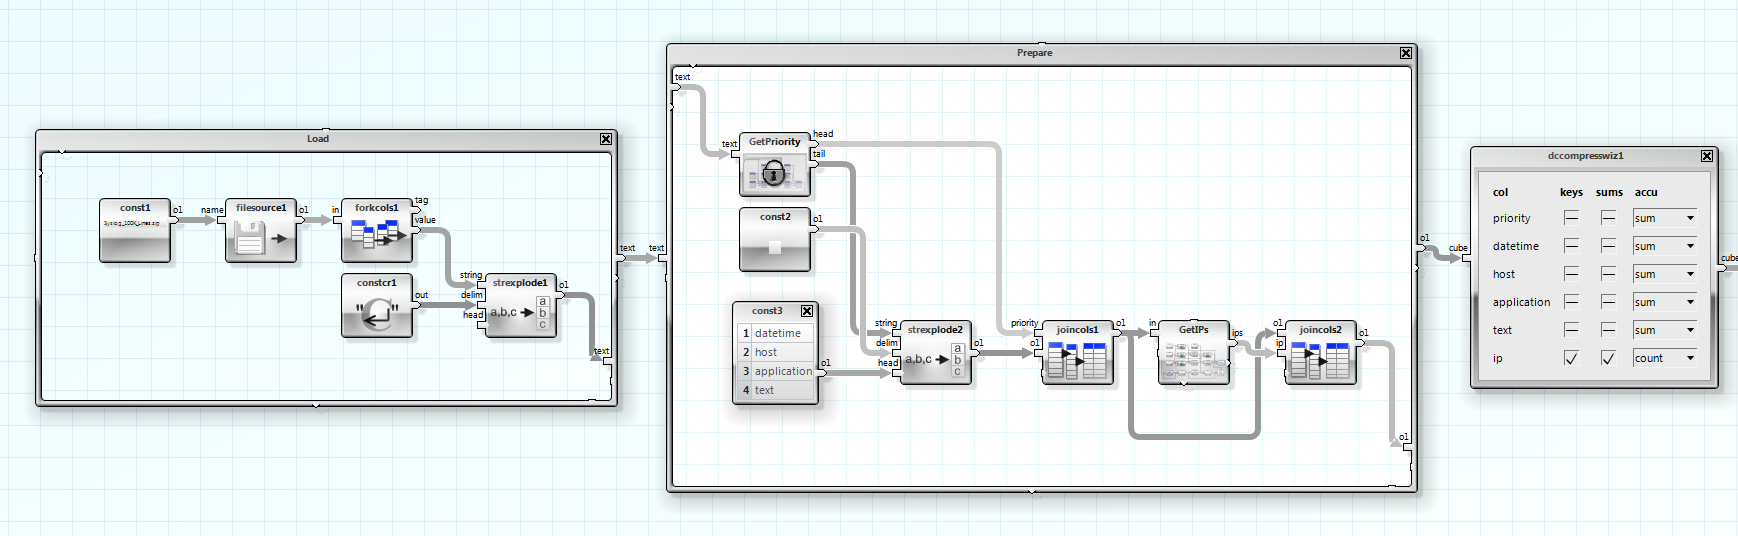
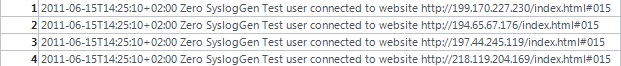
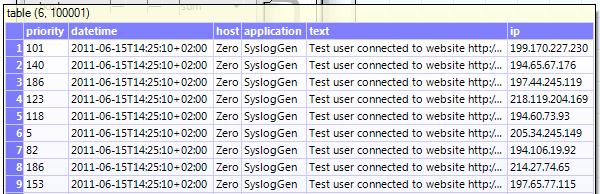
The first step was to read in the compressed logfile and convert it into a table.
You can inspect the first part of the resulting table when you hover the mouse over the output connector 'o1strexplode1'. It is a vector (table without a column header) with 100001 rows.
Our next job is to split the strings into columns.
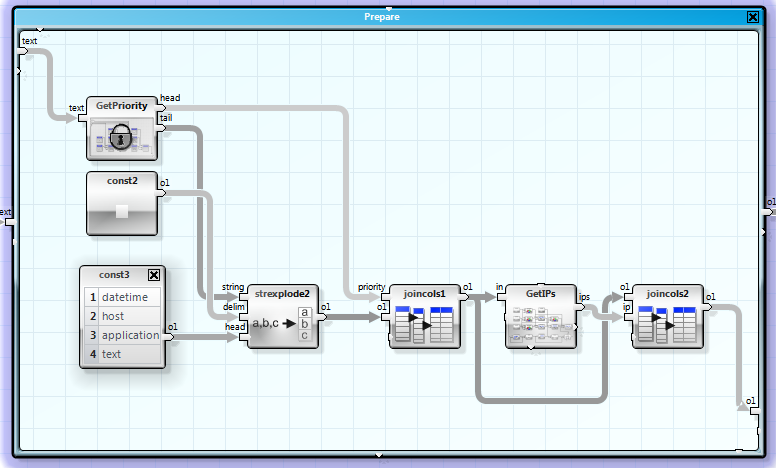
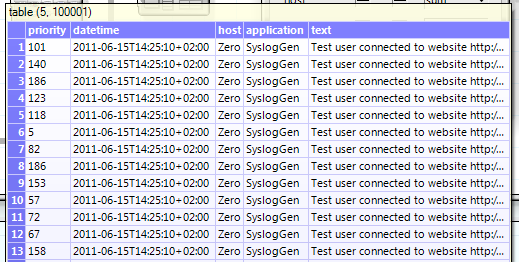
We route the vector into a macro 'GetPriority'. You may notice the lock icon, it marks this macro as an operator class. Operator classes are a great method to create 'reusable code'. If you need to change the behaviour of an operator class, let's says because of an error, you can do that without having the problem to alter all instances of this macro in this or other FlowSheets. You only have to update the FlowSheet once...
Because we can expect four 'spaces' as delimiters, the best fit here is a 'strexplode' operator. It gets the remaining part of the message :
and delivers back this table:
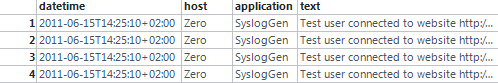
The single parts of the message are now joined together into a new table.
Now we extract the IP address out of the text column. This is also a combination of strplits, no magic.
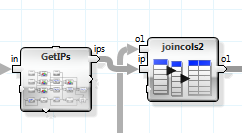
We attach the IP address to the table.
Now the fun part. We have ~100000 IPs now. In a traditional scripting language, you may start here programming loops, we use the operator dcCompressWizard from the DataCube library.
We just need to set two checkboxes and select the accumulation method.
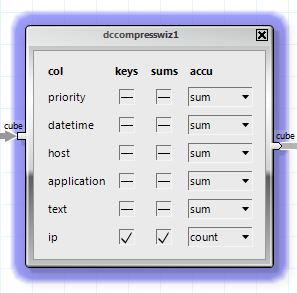
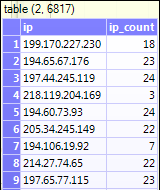
Result: A new table containing the unique IP address along with their access counts.
Your boss is happy! (It took only 5:35 minutes.)
A big advantage is that you can inspect the results after each step in the processing chain.
You develop with and not for the data...
Feel your data flow...