
Remote Threads Basics - Part 3
4.56/5 (6 votes)
Last part in my series about remote threads
This article is the last part in my series about remote threads. The first part of the series describes remote threads in general and could be found here. In the second part, it is written about creating permanently running thread with your code inside another process, and it could be found here.
In this article, I describe how to debug an application which creates remote threads with the help of Visual Studio. Also, this article covers the situation of debugging DLLs. As an example, I use demo application from the second part of the series which could be downloaded here.
The source code and all the following descriptions are written using Visual Studio 2010, but they are applicable to previous versions of Visual Studio as well.
Details of the Problem
The demo application which I am going to debug injects DLL into target process and creates remote thread which executes code from this DLL. The application communicates with remote thread via named pipe. The application asks the user to type an address in the console, tells remote thread to read this memory region from target process and shows the result in the console.
I want to debug DLL along with the main part of the application and check how both processes communicate with each other. So the code which I want to debug is distributed among two processes:
- Main process - It contains the code of my app which injects DLL into target process, creates remote thread and communicates with it.
- Target process - It is another application into which I inject my code. In general case, I have no source code of this program.
The situation is demonstrated in the picture:

Below, I'll show how to debug applications in such a situation. Also, the material could be used in the situation when you just need to debug your DLL.
To understand the material, you should know how to use Visual Studio debugger. If you are not familiar with it, you can find a very good article about using VS debugger here.
A Bit of Theory
The demo application which I am going to debug contains two projects:
InjectionDemo- project with the code of main processInjectionLib- project with the code of DLL which is injected into target process
Actually, I need to debug two processes simultaneously. Visual Studio is capable of doing it. In such a situation, you should run 'InjectionDemo' project at first, and then you should attach debugger to the process into which you will inject your code.
So, the general sequence of actions will be the following:
- Start target application (into which your code will be injected).
- Start Visual Studio and load your project into it.
- Place breakpoints and do other preparations before the debugging.
- Start debugging of main project ('
InjectionDemo'). - To debug remote process, attach Visual Studio to it. This could be done by invoking 'Debug->Attach to Process' menu item.
- Debug the application.
- Stop debugging. You may do this by terminating both processes, but if you do not want to terminate the target application, you may just detach the debugger from it.
Practice of Debugging in Pictures
In this section, I will show you a step-by-step guide of the debugging demo application with screenshots demonstrating each action.
1. Start Out Target Process and Determine its PID
As an example, in this article, I use windows calculator (calc.exe) as target process:

2. Start Visual Studio and Load Demo Application into it.
Make sure you select the appropriate project as the startup project. Name of the startup project is shown with bold font in the solution explorer:

3. Insert Breakpoints
For the purpose of demonstration, I have inserted a breakpoint in the beginning of RemoteMethod method:

Also, I have inserted a breakpoint in the line which injects our DLL into the target process:

4. Starting Main App
When all preparations are done, press F5 or invoke 'Debug->Start Debugging' menu item to start the main application:

5. Attaching Debugger to Target Process
To debug your code inside target process, you should attach debugger to it. To do this, you should select 'Attach to process' from 'Debug' menu:

You will see 'Attach to process' dialog, where you should select target process (in my case, it was calc.exe with PID=6120) and press 'Attach':

You should note that you may attach debugger to several processes, by repeating this step. In such case, you will be able to debug your DLL inside all of the processes into which debugger was attached.
6. Debugging Both Processes
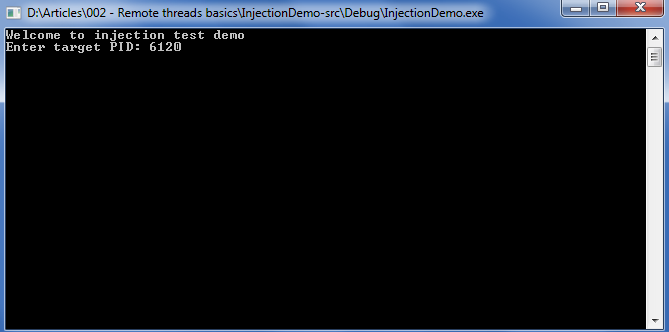
Debugger is running, and we can do some experiments with the app. Switch to main application and enter PID of target process:
After you type the PID and press 'Enter', Visual Studio will stop at the breakpoint at the line which injects our code into target process:

When you press F5 (to continue execution) of F10 (to execute just one line), our DLL will be injected into target process. After that, Visual Studio will stop at the breakpoint in the injected code:

You may place additional breakpoints, switch between debugged processes and threads, and do all things which you can do when debugging arbitrary application.
To finish the experiment, let's look at the memory of our target process executable module from the debugger, obtain it from our program and compare the results. Memory of calc.exe main module from the debugger:

Continue execution of both processes by pressing F5 and switch to main application. When you type base address of calc.exe, you will see the same data that was shown in the debugger:

7. Stop Debugging
When you want to stop debugging of the DLL, you should select 'Detach All' or 'Stop debugging' from 'Debug' menu:

As an alternative, if you select 'Terminate All', the target application will be stopped (and of course, you will exit debug mode). Also to stop debugging, you may quit all debugged processes.
Some More Tips
If you want to debug only the injected code, you should skip step 4. Also, you may debug your DLL which is somehow loaded into any process by repeating all steps except step 4.
In some situations, it could be more convenient to run two (or maybe more) instances of Visual Studio and use the first instance to debug the main application and the second instance to debug the target process. If you want to use several instances of VS, you should perform step 4 in the first instance and step 5 in the second instance of Visual Studio.