
Azure Veneziano – Part 3
5.00/5 (1 vote)
How to create your own telemetry control using Azure.
This is the third part of my Internet-of-Things telemetry project based on Azure.
The source of the project is hosted in the azure-veneziano GitHub repository.
The sample report as shown in this article can be downloaded here.
Here are the other parts:
In this article I’ll show you how to refine the notification of an event by creating a detailed data report.
This post closes the basic part of the project. There will be other articles related to the Azure Veneziano project, but they are mostly additional components and enrichment to the base system.
The problem.
When the system alerts you about, for instance, the outside temperature which is getting higher the more is sunny, I believe there’s no need of any detail on.
However, the things could turn dramatically different if you receive a notification such as “your aquarium temperature is greater than 35°C”. Unless you have very special fishes, there are just two possibilities:
- the fishes are in a serious danger, or
- something is broken (e.g. the probe, the wiring, etc).

In the first case, there’s no other way than making some immediate action before the fishes die. In the second case, you could even tolerate the failure knowing that the system is unable to work properly, until it will be fixed.
However, if you’re at the mall, for instance, and you receive such a mail: what would you do? Better question: how to know what kind of problem is? Also, how the system evolved before facing the issue?
Of course you can add “redundancy” to the telemetry system, so that you’ll have more info (and that’s always a good thing). For instance, you could use two probes instead of just one. Since the fishes life is in danger, a probe more is actually a natural choice.
Anyway, if you receive a simple message like “the water temperature is 55°C”, you can’t understand where the problem is. A bit different if the message shows you the “evolution” of that temperature. If the evolution acts like a “step”, where the temperature rises to a prohibitive value in a few time, then it’s probably something broken in the hardware. Reasonably, the aquarium tank can’t get hotter in minutes or less.
All that depicts a scenery where a collection of values over time is an useful “attachment” to the alerting message. Here, the target is representing the data collected as both chart and table fashion.
Looking for the right library.
As for report I mean a simple document, which contains details on what happened. For this project, we’ll create a three-pages report with a couple of charts, and also a brief tabular history of the collected data.
Once again, I’d like to remember that this project is a kind of “sandbox” for something professional. Thus, I prefer to try “a bit of everything” in order to take practice with the environment: Azure at first, then several accessories. For this reason, I wanted the ability to create the report document in both Word- and PDF-format.
Around the Internet there is plenty of creation and conversion tools, but most of them are very expensive. In a professional context that would be feasible, but of course isn’t acceptable for any home/hobby target.
Finally, I bumped against the Spire.Doc Free-edition by e-iceblue.
They offer a complete suite of tools for many standard formats. Despite their regular price is off the hobbyist-pocket, they also offer the Free-Edition option. I tested only the Spire.Doc component (tailored for the Word documents), and the limitations are pretty acceptable. At first glance some limitation looks like a wall, but it’s easy to play around the APIs and to find the right trick!
Moreover, when I had some trouble with the library, I asked them an help by the forum, and the answer came very quickly.
How to create your own report.
The usage of the Spire.Doc library is very simple, however I created a series of support functions in order to specialize the code for the report creation.
It’s worthwhile to say that the generated report is meant as “attachment” for the notification mail, so the below code is called automatically when the logic sends a mail.
The only thing the logic should specify is the list of useful variables to detail in the report. That’s an obvious requirement, especially when you deal with many variables.
        public void Run()
        {
            LogicVar analog0 = MachineStatus.Instance.Variables["Analog0"];
            LogicVar analog1 = MachineStatus.Instance.Variables["Analog1"];

            if ((analog0.IsChanged || analog1.IsChanged) &&
                (double)analog0.Value > (double)analog1.Value
                )
            {
                var message = "The value of Analog0 is greater than Analog1.";

                var mail = new MailMessage();
                mail.To.Add("vernarim@outlook.com");
                mail.Body = message;

                var rdp = new ReportDataParameters();
                rdp.OverviewText.Add(message);

                rdp.PlotIds.Add("Analog0");
                rdp.PlotIds.Add("Analog1");
                rdp.PlotIds.Add("Switch0");
                rdp.PlotIds.Add("Switch1");
                rdp.PlotIds.Add("Ramp20min");
                rdp.PlotIds.Add("Ramp30min");

                MachineStatus.Instance.SendMail(
                    mail,
                    rdp
                    );
            }
        }
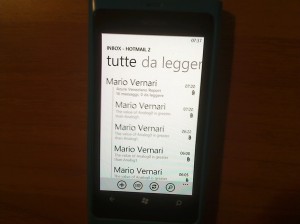
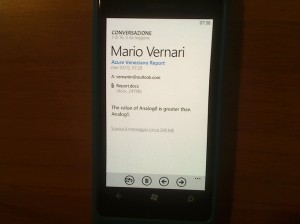
Here is the mail incoming in my mailbox…

…and here once I open the message:

Let’s walk the report generation code step-by-step…
The very first thing is to specify some personalization data, such as the title, some pictures, and even the page size (default is for European A4-sheet).
        private void CreateReport(
            MailMessage mail,
            ReportDataParameters rdp
            )
        {
            //set the basic info for the report generation
            var info = new ReportGeneratorInfo();
            info.ProjectTitle = "Azure Veneziano Project";
            info.ProjectUri = "https://highfieldtales.wordpress.com/";
            info.ProjectVersion = "2014";

            info.ReportTitle = "Alert Data Report";

            //cover logo image
            var stream = this.GetType()
                .Assembly
                .GetManifestResourceStream("AzureVeneziano.WebJob.Images.WP_000687_320x240.jpg");

            info.CoverLogoImage = new System.Drawing.Bitmap(stream);
Then, since the cover is made up from a well-defined template, its creation is straightful immediately after the document model. I also used an extension-method pattern so that the various function invocation will shape as fluent-fashion.
            /**
             * Cover
             **/
            var document = ReportGeneratorHelpers.CreateDocument(info)
                .AddStandardCover(info);
What’s behind?
There’s nothing secret. Those functions are only a shortcut for easy manipulating a report, but anyone could create his/her own functions.
The document generation creates a Document instance, defines its properties as well as the available styles. Please, note that the library comes with several pre-defined styles, but I wanted to create my own:
        /// <summary>
        /// Create a new Word document based on the given parameters
        /// </summary>
        /// <param name="info"></param>
        /// <returns></returns>
        public static Spire.Doc.Document CreateDocument(
            ReportGeneratorInfo info
            )
        {
            //create new document
            var document = new Spire.Doc.Document();

            /**
             * Define styles
             **/
            {
                var style = new Spire.Doc.Documents.ParagraphStyle(document);
                style.Name = "Title";
                style.CharacterFormat.FontName = "Calibri Light";
                style.CharacterFormat.FontSize = 28;
                style.CharacterFormat.TextColor = System.Drawing.Color.FromArgb(91, 155, 213);
                style.ParagraphFormat.BeforeSpacing = InchesToDots(0.2);
                style.ParagraphFormat.AfterSpacing = InchesToDots(0.2);
                document.Styles.Add(style);
            }

            // ...

            //create section...
            Spire.Doc.Section section = document.AddSection();
            section.PageSetup.DifferentFirstPageHeaderFooter = true;
            section.PageSetup.DifferentOddAndEvenPagesHeaderFooter = true;

            //...define page size and orientation
            section.PageSetup.PageSize = info.PageSize;
            section.PageSetup.Orientation = info.PageOrientation;

            //...then margins...
            section.PageSetup.Margins.Top = InchesToDots(info.PageMargin.Top);
            section.PageSetup.Margins.Bottom = InchesToDots(info.PageMargin.Bottom);
            section.PageSetup.Margins.Left = InchesToDots(info.PageMargin.Left);
            section.PageSetup.Margins.Right = InchesToDots(info.PageMargin.Right);

            /**
             * Page header
             **/

            // ...

            /**
             * Page footer
             **/

            // ...

            return document;
        }
So far, so well.
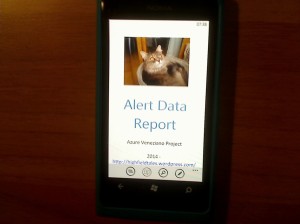
If you wonder what’s the result at this point, here is a snapshot:

Please, since I was running out of logo pictures of my “Home Company”, I turned for a picture of my boss, far serious than many CEOs all around the world.
Hope you love her!
Let’s turn page: here the work begins to get harder.
The second page should give a brief overview of what happened at the very beginning. At first glance, the reader should mean WHY the mail has been sent. That’s still pretty easy to do, because it’s just a bunch of “Paragraph” to insert into the current page.
            /**
             * Page 2
             **/

            //overview (brief description)
            document.AddHeading1("Overview")
                .AddNormal(rdp.OverviewText)
                .AddBreak(Spire.Doc.Documents.BreakType.LineBreak)
                .AddBreak(Spire.Doc.Documents.BreakType.LineBreak);
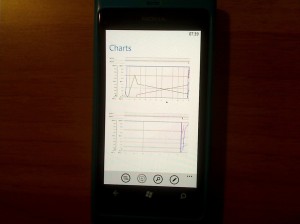
Since some lines of text shouldn’t steal much space on the page, I want to place a couple of charts about the most recent evolution of the selected variables.
Later we’ll cover how the chart generation works.
            //charts
            var chart1 = this.CreateChart(
                rdp,
                rdp.DateTimeBegin,
                rdp.DateTimeEnd
                );

            var chart2 = this.CreateChart(
                rdp,
                rdp.DateTimeEnd - TimeSpan.FromMinutes(15),
                rdp.DateTimeEnd
                );

            document.AddHeading1("Charts")
                .AddFrameworkElement(chart1)
                .AddBreak(Spire.Doc.Documents.BreakType.LineBreak)
                .AddFrameworkElement(chart2)
                .AddBreak(Spire.Doc.Documents.BreakType.PageBreak);
Here is how the second page looks:

The third (and likely last) page is for the tabular view of the most recent data.
Why showing the same data twice?
Because charts and tables aren’t the same thing: each one has its own pros and cons.
            /**
             * Page 3
             **/

            //data table
            var table = new ReportDataTable();

            {
                //add the date/time column
                var column = new ReportDataTableColumn(
                    "Timestamp",
                    "Date/time",
                    new GridLength(1, GridUnitType.Star)
                    );

                table.Columns.Add(column);
            }

            //add the remaining columns
            foreach(string id in rdp.PlotIds)
            {
                var plot = MyPlotResources.Instance.GetPlot(id);
                var column = new ReportDataTableColumn(
                    plot.InstanceId,
                    plot.Description,
                    new GridLength(0.75, GridUnitType.Pixel)    //inches
                    );

                table.Columns.Add(column);

                if (table.Columns.Count >= 7)
                    break;
            }

            //query the DB for the most recent data collected
            using (var sqlConnection1 = new SqlConnection(SQLConnectionString))
            {
                sqlConnection1.Open();

                var sqlText =
                    "SELECT * FROM highfieldtales.thistory " +
                    "WHERE __createdAt >= @begin AND __createdAt <= @end " +
                    "ORDER BY __createdAt DESC";

                var cmd = new SqlCommand(
                    sqlText,
                    sqlConnection1
                    );

                cmd.Parameters.Add(
                    new SqlParameter("@begin", rdp.DateTimeBegin)
                    );

                cmd.Parameters.Add(
                    new SqlParameter("@end", rdp.DateTimeEnd)
                    );

                using (SqlDataReader reader = cmd.ExecuteReader())
                {
                    while (reader.Read())
                    {
                        var row = new ReportDataTableRow();
                        row["Timestamp"] = reader["__createdAt"].ToString();

                        var colName = (string)reader["name"];
                        row[colName] = string.Format(
                            "{0:F1}",
                            (double)reader["value"]
                            );

                        table.Rows.Add(row);

                        if (table.Rows.Count >= 50)
                            break;
                    }
                }
            }

            document.AddHeading1("Table")
                .AddTable(table);
It’s worthwhile noting that I didn’t use the Table APIs as the library exposes. Again, I wanted to play around the library to face its flexibility.
At the end, I used the “tabulation-technique” and I must admit that the Spire.Doc library is very easy yet very powerful to use.

The very last thing to do is obviously to save the composed document. As described earlier, there’s no a permanent place where the document is stored, rather it is streamed directly as attachment to the mail.
Here below there is the snippet for both the Word- and the PDF-formats, so that the mail will carry two identical reports, then the user can open with the favorite reader.
            {
                //save the document as Word
                var ms = new MemoryStream();
                document.SaveToStream(
                    ms,
                    Spire.Doc.FileFormat.Docx
                    );

                ms.Position = 0;
                var attachment = new Attachment(
                    ms,
                    "Report.docx",
                    "application/vnd.openxmlformats-officedocument.wordprocessingml.document"
                    );

                mail.Attachments.Add(attachment);
            }
            {
                //save the document as PDF
                var ms = new MemoryStream();
                document.SaveToStream(
                    ms,
                    Spire.Doc.FileFormat.PDF
                    );

                ms.Position = 0;
                var attachment = new Attachment(
                    ms,
                    "Report.pdf",
                    "application/pdf"
                    );

                mail.Attachments.Add(attachment);
            }
That’s it!
How does it appear on my phone?
I believe it’s funny trying to read a data report on a phone. I mean that even on a relatively small screen you can read the same things as you were on a PC. Well, it’s not as easy as it looks, but I really love it as a start point!
Nice enough!…
Some words about the PDF document creation.
As you know, the Azure Veneziano project has been built against a totally free environment. By the way, the free websites that Azure offers where this WebJob runs, come with some limitation. In this case, the Spire.Doc library require GDI/GDI+ for the PDF generation, and that’s unavailable/unsupported by the Azure free context.
I fully tested the PDF generation in a desktop application, and the result was always perfect. However, if you need the Azure-side PDF generation, I believe there are at least two choices:
- move the WebJob to a Cloud Service/VM (or any paid context) as suggested here;
- leverage some online services such as this one, which offers up to 500 documents per months fro free.
The chart generation.
There are plenty of chart libraries on the web, both free and commercial. However, I created my own charting library because I needed several features that they’re hard to find all around. More specifically, my charting library is tailored for our industrial supervisory control systems, where the requirements are very different from, for instance, financial applications.
For the Azure Veneziano project, I took a small fraction of this library, but far enough to render multi-plots, multi-axes, WPF charts.
The usage is pretty simple, although an user may find uselessly verbose the code. Again, that’s because the original library is full-featured, and many functions don’t come easy without a certain dose of source code.
        private FrameworkElement CreateChart(
            ReportDataParameters rdp,
            DateTime dtBeginView,
            DateTime dtEndView
            )
        {
            var uc = new MyChartControl();

            /**
             * CHART MODEL
             **/
            var cm = new ChartModelXY();
            uc.DataContext = cm;

            foreach (string id in rdp.PlotIds)
            {
                cm.Plots.Add(
                    MyPlotResources.Instance.GetPlot(id)
                    );
            }

            //adds the required axes
            foreach (var plot in cm.Plots)
            {
                var cartesian = plot as ChartPlotCartesianBase;
                if (cartesian != null)
                {
                    ChartAxisBase axis;
                    axis = MyAxisResources.Instance.AddWhenRequired(cm, cartesian.HorizontalAxisId);
                    axis = MyAxisResources.Instance.AddWhenRequired(cm, cartesian.VerticalAxisId);
                }
            }

            //update data from source
            using (var sqlConnection1 = new SqlConnection(SQLConnectionString))
            {
                sqlConnection1.Open();

                var sqlText =
                    "SELECT * FROM highfieldtales.thistory " +
                    "WHERE __createdAt >= @begin AND __createdAt <= @end " +
                    "ORDER BY __createdAt ASC";

                var cmd = new SqlCommand(
                    sqlText,
                    sqlConnection1
                    );

                cmd.Parameters.Add(
                    new SqlParameter("@begin", dtBeginView)
                    );

                cmd.Parameters.Add(
                    new SqlParameter("@end", dtEndView)
                    );

                using (SqlDataReader reader = cmd.ExecuteReader())
                {
                    while (reader.Read())
                    {
                        var timestamp = (DateTimeOffset)reader["__createdAt"];

                        var name = (string)reader["name"];
                        var plot = cm.Plots
                            .FirstOrDefault(_ => _.InstanceId == name);

                        var dbl = plot as ChartPlotCartesianLinear;
                        if (dbl != null)
                        {
                            dbl.Points = dbl.Points ?? new List<Point>();

                            var pt = new Point(
                                timestamp.Ticks,
                                (double)reader["value"]
                                );

                            dbl.Points.Add(pt);
                        }
                    }
                }
            }

            var timeline = cm.Axes
                .OfType<ChartAxisTimeline>()
                .FirstOrDefault();

            if (timeline != null)
            {
                timeline.LowestBound = rdp.DateTimeBegin.Ticks;
                timeline.HightestBound = rdp.DateTimeEnd.Ticks;

                timeline.LowerBound = dtBeginView.Ticks;
                timeline.UpperBound = dtEndView.Ticks;
            }

            uc.Measure(new Size(uc.Width, uc.Height));
            uc.Arrange(new Rect(0, 0, uc.Width, uc.Height));

            cm.InvalidateRender();

            return uc;
        }
The only “strange” thing is that we actually DO NOT HAVE a WPF application, but something like a Console application, “hidden” somewhere in the Azure cloud.
However, this isn’t surprising at all, because the above code instantiate an UserControl as container for the chart. Once the chart model setup is done, there’s a “fake” measuring+arranging pass, followed by a final rendering against the control’s face.
The very final step is to capture the visual of this usercontrol and save as a bitmap image (PNG format). This image is inserted in the document as usual
        /// <summary>
        /// Render a visual to a bitmap image
        /// </summary>
        /// <param name="visual"></param>
        /// <param name="width"></param>
        /// <param name="height"></param>
        /// <returns></returns>
        private static System.Drawing.Image SaveImage(
            Visual visual,
            double width,
            double height
            )
        {
            var bitmap = new RenderTargetBitmap(
                (int)width,
                (int)height,
                96,
                96,
                PixelFormats.Pbgra32
                );

            bitmap.Render(visual);

            var image = new PngBitmapEncoder();
            image.Frames.Add(BitmapFrame.Create(bitmap));
            var ms = new System.IO.MemoryStream();
            image.Save(ms);

            return System.Drawing.Image.FromStream(ms);
        }
Thankfully, the free context of Azure supports without any pain the WPF framework.
Conclusions.
As said many times, this article closes the project as essential.
From this time on, there will be some other projects which could extend yet improve the base.
Keep in touch!

![]()