
Remote debugging Windows Azure Cloud Services from Visual Studio 2013
5.00/5 (3 votes)
When your cloud services have been deployed and things are maybe not going quite as you expected, the first thing you may turn to is diagnostics.
When your cloud services have been deployed and things are maybe not going quite as you expected, the first thing you may turn to is diagnostics. I recently ran into a scenario where using a Dev-Ops cloud logging service which was normally full of logs and graphical richness, decided to have it's own cloud moment and stop logging for a downtime period. This was compounded by issues that had arisen with a deployed service and understanding what was behaving unexpectedly was crucial, especially as all Integration, Smoke and Black Box tests as well as the local environment was working fine. I still had my trusty native Azure Diagnostics and Trace information inside table storage and text files but i needed more. In no time at all i was stepping through my code in the cloud as if it was running locally, well almost.
One of the nice features added to the Azure SDK 2.2 is remote debugging support for Windows Cloud Services. What makes it especially appealing is the ease at which you can debug Web and Worker roles, deployed to Azure using Visual Studio and just how simple it is to setup, which if you attempted in earlier releases of the SDK, you will appreciate.


Click on the link in the Azure activity log shown previously to open your web role.
The web site runs in Azure as shown below.


One of the nice features added to the Azure SDK 2.2 is remote debugging support for Windows Cloud Services. What makes it especially appealing is the ease at which you can debug Web and Worker roles, deployed to Azure using Visual Studio and just how simple it is to setup, which if you attempted in earlier releases of the SDK, you will appreciate.
Remote Debugging Walkthrough
Prerequisites
1: Create a Cloud Service
Feel free to skip this section if you are familiar with the process and want to jump to the good stuff.
Select a Web Role and Worker Role
Select Web API as the ASP.Net project web model
Having clicked 'OK' you will now have a cloud service project with two roles. Place your breakpoints in the desired locations, one in the worker and the other in the web controller as shown. Even though we haven't yet attached the debugger, it shows our intent for the next steps.
2: Setup Publish Settings
Now we have our boilerplate project, it's time to publish.
Select 'publish' from the cloud project as shown.
Either select 'Sign In' or if the pop up window appears in the next screen shot appears use that. either way enter your credentials you gained from creating your Azure account in the portal.
Once logged in, either create a new Cloud Service by selecting 'Create New' from the Cloud Service dropdown as shown below.
OR, select an existing Cloud Service if you created one previously as shown.
The important step at this point is to select 'Debug' as the Build Configuration as shown.
Select 'Enable Remote Debugging for all roles' as shown.
3: Publish
We are now ready to publish. Ensure the Remote Debugger is set to 'Enabled' as shown and select publish.
The progress of the deployment is shown in the Azure activity log as shown.
Once complete, the staging link will change to a deployment link as shown.
4: Attach to the debugger
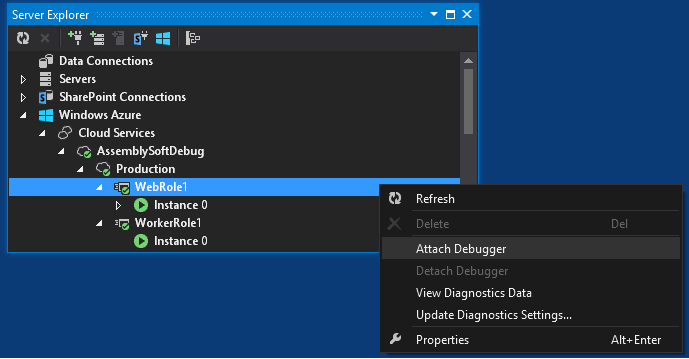
Once the roles have initialized and started, you will be able to see your role instances in Server Explorer as shown.
Right click on an instance and select 'Attach Debugger'.
Click on the link in the Azure activity log shown previously to open your web role.
The web site runs in Azure as shown below.
Ensure your breakpoint is set in the controller and navigate to the API endpoint as shown below.
Your breakpoint is hit, in your local Visual Studio instance for your deployed role.
Additional Reading - How does it all hang together
When you turn on remote debugging, it packages Microsoft Visual Studio Remote Debugging Monitor (MSVSMON.EXE) as well as supporting components and deploys them to each virtual machine selected.Orchestrating the process are two components, the Connector and Forwarder.
Connector
The Connector is a web service which establishes a secure tunnel between Visual Studio and the Forwarder
Forwarder
The Forwarder forwards commands in the form of requests to msvsmon.
The following diagram taken from MSDN illustrates the communication between Visual Studio, the Connector, Forwarder and msvsmon.
The configuration of the component endpoints is added to the ServiceDefinition.csdef during the package process. Of particular note are the port ranges used by each component as shown below.
Note - It may be possible to incur conflicts if other applications or services use the same port numbers.
References
Visual Studio 2012 Support
Remote Debugging Windows Azure Cloud Services with Visual Studio 2012
Conclusion
This has been a big boost to deployment productivity and fault finding recently and it's certainly much easier than it was before to configure and get going. Happy debugging those cloud deployments!