
Introduction to dragonchart-Open-Source Infographics Drawing Component Based on HTML5
Introduction to dragonchart-open-source infographics drawing component based on HTML5
Introduction To DragonChart
Dragonchart is an open-source infographics drawing component based on Canvas of HTML5. Generally speaking, pictures are always more impressive than words to display some data. Imagine that you were an editor focused on IT industry and you have a work to write an article about each PC manufacturer's market share recently. On the one hand, of course you need to write hundreds of words in your article like ‘lenovo shares 15.5%, Dell shares 13.2%....’ or something similar; On the other hand, you shall put a picture, pie chart or bar chart, along the words to deepen the impression to readers how data woks. Large amounts of data are generated by people of each industry, when the data needs to be displayed to others, then a chart picture is needed too. Dragonchart is such a tool to draw chart pictures.
There are several similar drawing tools before dragonchart, such as jqplot, highcharts, etc. Including dragonchart, these web drawing tools can be divided into three categories: one is using non-HTML technology such as Flash, Silverlight; two is using vector markup language which is designed to draw vector pictures in browsers in earlier times, such as VML (only supported well in Internet Explorer) and SVG (Standards W3C recommends), take highcharts as pretty example using SVG; three is using HTML5 Canvas element, dragonchart belongs to this category.
Here’s just a rough introduction to Canvas element in this article, you can Google it for more detailed information. Just like the name, a Canvas element is just like a canvas and the developer is just like a painter. While developers use JavaScript to handle DOM objects, so JavaScript can be compared as Paintbrush. Strictly speaking, ctx object which can be got by calling canvas.getContext(‘2d’) is more like a canvas than Canvas element itself. When you get the ctx object, you can call quite a few functions to draw what you like on the canvas, such as a line, a circle, fill it or stroke it. Theoretically speaking, you can draw anything you like with these functions. By the way, by redrawing part or whole of canvas, you can get animation effects on the canvas, so you can make a game using Canvas element.
I spent nearly five months of non-work time to code dragonchart and build the website to display it. There are 27 types (including 2D and 3D) of charts that dragonchart supports so far. You can download the source code of dragonchart on CodeProject at the top of the article.
Structure of Source Code
I take ligerUI (wrote by a clever coder) as reference and design dragonchart as [core+types] mode. Just like the name, dragonchart is made up of dragonchart.core.js and a few dragonchart.[type].js. There are several advantages of this mode:
- Reusability: a lot of same functions needed in different types of charts are written in core.js, so that reusability is achieved;
- Independence: specific function is written in each type.js, does not interfere with each other.
- Expansibility: I can add a new type of chart with least risk to destroy structure of old types.
- Maintainability: When I
need to change some code, I can find the target code quickly.
Layout of options is quite important for a component like dragonchart. Too simple, users cannot control the charts in details which makes them unable to get what them want to draw; too complex, users are lazy to know every option and that makes them lack of motivation to know deeply about this component, even give it up sometimes. As this situation, I design at most two-level options. Common options are defined in dragonchart.core.js, specific options are defined in each dragonchart.[type].js.
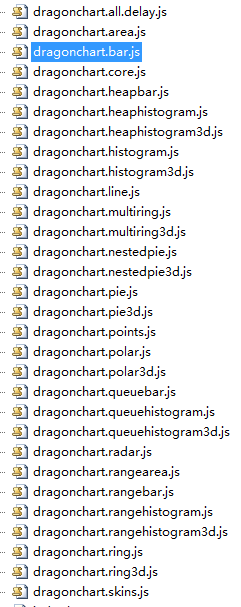
Below is the list of dragonchart’s source code. In addition to core.js and 27 [type].js, there’re another two extra js: all.delay.js and skins.js which I will introduce later.
Structure of a Dragonchart Picture
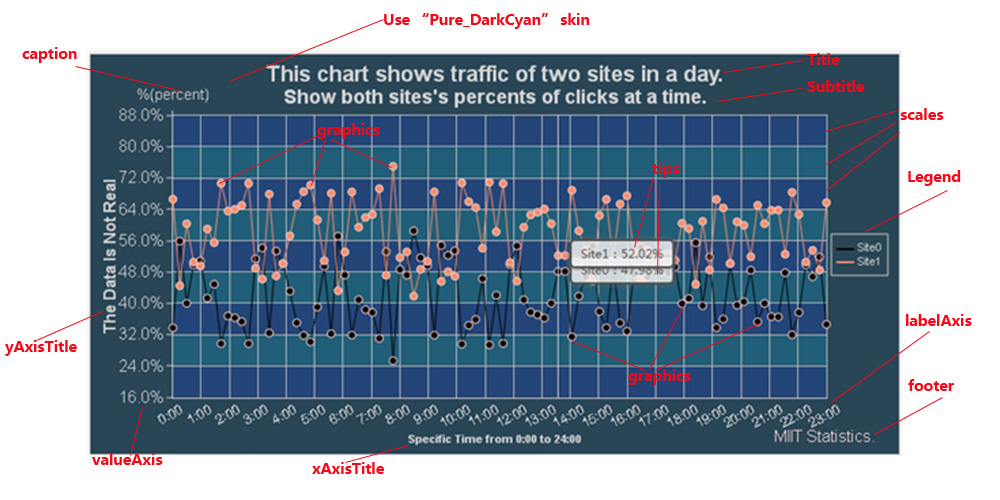
As you can see, this picture is made up of several parts, including title, subtitle, legend, scales, tips, axis, axistitle, footer, caption, and core graphics elements of course.
Some parts are necessary, some are not. Core graphics elements are surely necessary. when drawing axis pictures, such as bar, histogram, line, area, etc., label axis and value axis are necessary then. When drawing non-axis pictures, such as pie, ring, radar, etc., axis are unnecessary.
Besides above parts that dragonchart supports natively, you can draw extra elements to the picture using custom drawing function that dragonchart supports, theoretically you can get a picture of whatever you expect.
Version Update
There’re two version updates of dragonchart so far.
From dragonchart 1.0 to dragonchart 1.1, besides fixing some bugs, the most important change is that six types of charts are added. Original types include: Pie, Ring, MultiRing, Polar, Radar, Bar, HeapBar, Histogram, HeapHistogram, Line, Points, and Area. Added types in dragonchart 1.1 include: RangeBar, RangeHistogram, RangeArea, NestedPie, QueueBar, QueueHistogram. Thanks to the “core+[types]” mode, it takes me little time and effort to complete this version update.
The version update from dragonchart 1.1 to dragonchart 1.2 is just like a nightmare to me, very true at least in the early period. There’re three big improvements in this version update:
- Nine 3D types of charts are added: I find 3D a little cooler than 2D, so I decide to add 3D types to dragonchart. At first, I estimate just a little effort to finish them while I find I am wrong soon after. I had to change some core functions in core.js and add some 3D related options.
- Support plugins: plugin is another chart in the same picture. For example, when you need an extra pie chart in a line chart, you need to add a pie plugin to a line chart. Honestly speaking, I have ever considered plugins support before I complete dragonchart 1.0, but because basic structure had been established, I am lazy to destroy and rebuild it. Well, I have tasted the bad consequences. In the end, I take one week to rebuild whole dragonchart carefully and successfully support plugins.
- Add legend control: highcharts has a pretty function: to control if some data is visible or not by clicking the legend. Thanks to the rebuilding to support plugins, it becomes quite easy to add this important function.
I have got some conclusions through these version updates:
Though not every aspect can be thought about in the designing period, we should design carefully to prepare for further changes in the future. I know it’s quite easy to say it than do it, but we really need to pay attention to that.
- If you want your software to be perfect, you can never relax. Sometimes we might find our software a little defective and we think: little problem just let it go. At first I am in such a way, but when I watch dragonchart no value compares to other similar charts drawing tools, I finally stimulate myself to be “paranoid” about coding and add some useful functions like custom drawing, skins, plugins, etc. to dragonchart . Now I think it is strict attitude of perfection that made Steve Jobs succeed than his other excellent qualities.
- Design a lot then code a little. Blind coding will waste your time and effort, good design will lessen your work while strengthen functions to your software.
Simple Introduction to Inner Properties, Events and Functions of a DChart Object
Properties
DrawFigures: This object includes functions to draw custom graphics, such ascreateText,createLine, etc. Use can call these functions to draw extra graphic element to meet special needs.GraphType: This property records current graphic type, such as ‘Pie’, ’Radar’, etc.ID: This property saves an ID string to identifyDChartof current usage.LanguageCanvas: This object is the DOM object that is created inside parentdivDOM.Coordinates: This object collects coordinate information that every graphic element was drawed, such as size, location, etc.ctx: Object get fromcanvas.getContext('2d')innerData: This object saves data that user passes (if user uses pure-array data, theninnerDatasaves normal object data thatDCharttransferred from pure-array data).innerOptions: This object saves options that user passes.shapes: This array saves temp shapes in process of drawing graphic. It is used to redraw part or whole graphic, get coordinate information, response mouse events, etc., important usages._configs: like the name, configs is used insidedchartobjects.
Events
onStart: Built-in event, executed whenDChart‘starts to work’.onBeforeAnimation: Built-in event, executed whenDChartbegins animation.onAnimation: Built-in event, executed when animation is on. A parameter is passed to the function that shows animation percentage of completion.onFinish: Built-in event, executed whenDChartfinishes current drawing task.
Functions
AddPlugin: Add a plugin to dragonchart.ChangeLanguage: Change the inner language.ClearBackGround: Clear all elements in canvas, include canvas sketchpad, spans to show tips, saved shapes, etc.ClearPlugin: Clear all plugins added before.RemovePlugin: UnlikeClearPlugin, this function just removes one plugin.Draw: Key function, to start drawing graphics. This function has two parameters: data and options. User can pass one them, or neither of them only if make sure that: when data is not passed, functionSetDatamust be called before; when options are not passed, functionSetOptionsmust be called before.GetCoordinate: Get real-time coordinate information of graphic elements. Parameter location is the “path string” to locate the coordinate of what user needs to get. “.” Is used to express child items, such as “canvas.height” stands for height of canvas. User can use “.[index]” to get coordinate info in array format, for example, “pie.outerlabels.3.left” stands for left location of forth outer label of pie’s semicircles.Initial: Re-initialize canvas element. Works include to delete old canvas element(if exists), delete old styles in DCharts, add new styles, compute basic coordinate information of canvas, add new canvas element, initial configs, clear canvas, etc. In summary, this function is to initial a new canvas to draw graphics.SavePic: Export picture ofcanvas(Some browsers do not support). Parameters are filename and picture type, such as png, bmp, gif.SetBasicOptions: Change basic config forDChart. This function can change size of canvas, therefore when this function is called,Initialwill be called inside.SetData: Load data. This function is specially for loading data, Independent ofDrawfunction, the effect is consistent with loading data inDrawfunction.SetDefaultOptions: Set back to default options, include common options and specific options.SetOptions: Load options, just likeSetData, independent ofDrawfunction.SetSkin: Set skin forDChart. You can use built-in skins or your own custom skins.
Features of Dragonchart
Whole Features
- Pure html5 and Javascript, cross platform, does not rely on any frame. You can use it in PC, mobile, or any terminal that supports html5 and JavaScript.
- Support a variety of commonly used drawing type. Dargonchart supports 27 types (include 2D and 3D) of graphics so far, and more types are planned to be supported in the future.
- Support plugin graphics. You can put several types of graphics together at one picture.
- Support language set inside core code. Language set is designed for error message. If you use dragonchart in a wrong way, dragonchart will tell you where is wrong.
- Support for animation. Sometimes you may want to see the animation of progress to drawing a picture, because animation makes it cooler for the picture.
- Support skin set and customizing skins. Dragonchart has several built-in skins, you can just call
dchart_obj.SetSkinto apply then you get colorful pictures without setting options one by one. Of course, you can design your own skins according to personal preference. - Support 3D drawing of several graphics. You may find 3D a little cooler than 2D, so do I. So dragonchart supports 9 types of 3D graphics, such as Pie, Ring, Histogram.
- Record information of elements in position, size, for query. Dragonchart records the final coordinate information of important elements in the picture, such as the size of the title, position of legend, and so on. You can get all recorded coordinate information in
dchart_obj. coordinates. - Support custom drawing. Besides the normal elements to built the picture, you may need to add extra element (such as a text, line, cycle, etc.) to bring more information to the picture. The real-time coordinate information dragonchart recorded may do you a great favor.
- Support exporting picture. You can just call
dchart_obj.SavePicto export the picture, but only supports Firefox and several versions of chrome so far. - Lazy loading. Dragonchart is made up of dragonchart.core.js and many dragon.[types].js, when you want to draw a pie picture, you need to quote core.js and pie.js. This situation gets quite tedious when you need to draw picture with plugins. So dragonchart.all.delay.js came up to help. You can just quote dragon.core.js and dragonchart.all.delay.js, when you need pie, dragonchart will load pie.js once, when bar is needed, bar.js will be loaded once. Is it quite easier to use it?
Options Features
- At most two-level options, prevent inconvenience use caused by multiple levels.
- Multiple level priority of option setting(take
fontcoloras example, "data set">"option set">"skin set ">"default set"); - Check passed options, if some option is incorrect, then error with detail infomation will be thrown.
Data Features
- Use data source of json format. You know this feature seems like nonsense for a web developer. You just ignore it.
- Axes support number, percent (automatic compute), datetime (order of days), time (order of minutes), four different data types.
- Some characteristics in graphics directly set in the data (with a higher priority in performance than by option setting).
- Support pure array data source, make the source of json data structure simpler and clearer. Normal data is object contains value, text, etc. properties, this function supports array as data, but requires in the order of text(necessary), value(necessary), subitems, color, click, mouseover, mouseleave. Such as:
[['Shanghai', 23.47], ['Beijing',20.69], ['New York',19.88,'#ffffff',function(){alert('click!');}]]
A Simple Demo, Steps to Complete One by One
1, Quote DChart
You can just only quote dragonchart.core.(min.)js + dragonchart.all.delay.(min.)js; or quote dragonchart.core.(min.)js and the specific js due to drawing type, for example now I need to draw a pie graphic so I need another dragonchart.pie.(min.)js.
Be careful:
- dragonchart.all.delay.js doesn't contain real code in all graphics, it just uses delayed-load function, so all the [type.js] must really exist in the same directory with [all.js].
- If skin setting is needed, make sure dragonchart.skins.js is referred.
<script type="text/javascript" src="dragonchart 1.2/dragonchart.core.js"></script>
<script type="text/javascript" src="dragonchart 1.2/dragonchart.all.delay.js"></script>
<script type="text/javascript" src="dragonchart 1.2/dragonchart.skins.js"></script>
OR:
<script type="text/javascript" src="dragonchart 1.2/dragonchart.core.js"></script>
<script type="text/javascript" src="dragonchart 1.2/dragonchart.pie.js"></script>
<script type="text/javascript" src="dragonchart 1.2/dragonchart.skins.js"></script>
2, Arrange data source
The data source has three functions:
- Determines the size, location and other basic information of graphical elements
- Determines the color and appearance information of graphical elements
- Determines the interaction, mouse events of graphical elements
The following is a sample data collected, shows Firefox, Internet Explorer, Chrome, Safari, Opera, etc., five major browsers share:
var data = [{
    //define text(label) of a single element
    text: "Firefox",
    //define value of element
    value: 45,
    //define click event function for this element
    click: function (data, evt) { alert('This is Firefox, value is ' + data.value); }
},{
    text: "IE",
    value: 26.8,
    //Setting up feature through data has a higher priority than through options.
    extended: true
},{
    text: "Chrome",
    value: 12.8,
    //define click event function for this element
    click: function (data, e) { alert('Hi! This is Chrome explorer data!'); }
},{
    text: "Safari",
    value: 8.5
},{
    text: "Opera",
    value: 6.2
},{
    text: "Others",
    value: 0.7
}];
3, Set options
Options determine how each part of graphic should be drawn, such as title, subtitle, legend, axes, etc.
The following set title and subtitle, in default, the legend is shown, the final rendering graphics including the title, subtitle, legend and core graphic.
var options = {
    //Define title content
    title: { content: 'Top 5 Browsers from 1 to 29 Feb 2012' },
    //Define subtitle content
    subTitle: { content: 'Let see which brower shares the most.' }
};
4, Choose skin
The skin setting is not a necessary step. In order to show as much as
possible using the DChart, this example uses the simple
"BlackAndWhite" skin.
By the way, in addition to existing skins defined in
dragonchart.skins.js, DChart supports customizing skin.
5, Draw graphic
- Create a
divelement for receiving canvas - Arrange data source and set options
- New a
DChartObject - Draw
<div id="divCanvas" style="width: 800px; height: 400px;"></div>
//Create a DChart object according to div's id and language needed
window.dchart = new DChart.Pie('divCanvas', 'CN');
//Use "BlackAndWhite" skin
dchart.SetSkin('BlackAndWhite');
//Use options, you can directly call dchart.Draw(data, options) to use options and data at one time.
dchart.SetOptions(options);
//Start drawing. You can also call dchart.SetData(data) first, then call dchart.Draw() to achieve the same goal.
dchart.Draw(data);
//Below is a very simple way:
(new DChart.Pie('divCanvas', 'CN')).SetSkin('BlackAndWhite').Draw(data, options);
6, Check result

Ending Words
This article just gives a simple introduction to dragonchart, if you want to know more about dragonchart, just click here to visit my website. "DChart Online Editing And Demonstration Center"(click here) on at my website provides you real-time designs to draw a picture. "DChart Customizing Skins"(click here) allows you to customize your own skin. You can get detailed instructions of dragonchart options on the “Documents” page.