
Techniques to "Fault Find Issues" - Within Your Remote WCF Services
5.00/5 (4 votes)
Know how to find issues within your deployed WCF services
- Download code: RemoteDebugginWcf.zip
Tracing WCF Remote Requests
Prerequisites
- .NET 4.5 installed on your IIS server (you can alter the code to use .NET 4.0)
- Visual Studio 2012 Express (to view\compile\deploy project)
- Soap UI
- WCF Test Client
- Service Trace Viewer – Installing link
- Remote Debugger Software
Introduction
Below is the VS2010 support for remote debugging (for this demo we will only be interested in the debugging of C#).
Within this blog, I want to show you how you can use tracing to provide us with the sequence of calls between the client and the remote services (including calls between remote services themselves).

For this tracing section, you will want to deploy the code in such a way as to mimic a remote call. For an easy setup scenario I am going to create another web site within my local IIS, called RemoteService”. I will deploy the remote service project to this site and the local service project to my “Default Web Site”. My client (WPF) application will consume the local service and the local service will consume the remote service. So, I will be making remote calls from my client using the local service as a proxy.
The scenario I have set out, is that I am having errors returned by my local service and also my remote service – some of the errors are WCF FaultException’s and some are more general exceptions (I have used the “DivideByZeroException” within the services).
IIS Setup
Create a new Site within IIS (This will act as your remote site server location). From fig. 1 you can see that I have named the site “RemoteService, it will have a port number of 81 (or what is next available within your own IIS setup). It will use the same App Pool account as your existing “Default Web Site” – see fig. 2.


Project Structure
If you open the solution (fig. 3) you will notice that there are four projects, within the solution. One for the client application, the two services and a common model project (this is just to share data structure between the service projects).

Editing the Trace Section Within the Configuration Files (Services & Client Application)
Remote Service
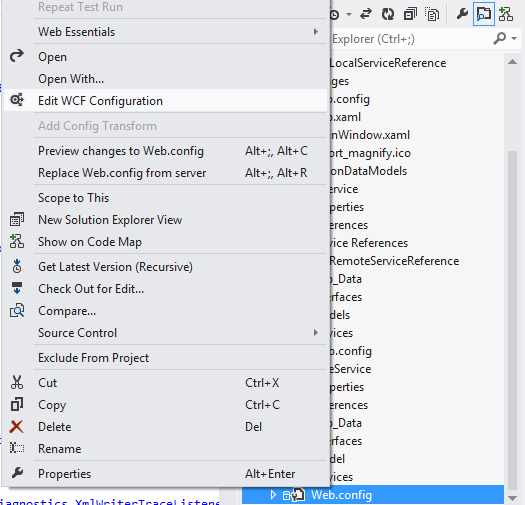
Edit the configuration file using the WCF Editor, by right click the configuration file and selecting “Edit WCF Configuration” option from the context menu (fig. 4).
Remote Service Settings
You can see the configuration settings for the remote service in fig. 5. Below that, is the XML representation of the configuration settings, within the “System.Diagnostics” section (fig. 8).

Make sure you have the trace settings (“Propagate activity” and “Activity tracing”) enabled, as in fig. 6. Do this for the services and the client application configurations, this is what is used to trace individual calls from client through to the remote service. You can edit the trace setting by clicking on the “Trace Level” link, within the tracing section.

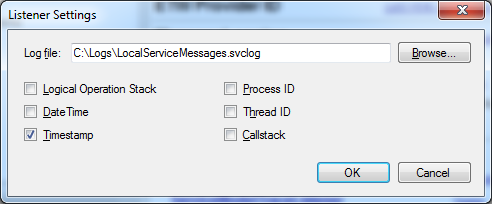
Configure the “Listener Setting” (fig. 7) by clicking on the “ServiceModelTraceListener” link and set the path and file name (I have used the same path for each service and client settings - with a unique file-name that informs me of its contents ), also enable the time-stamp check-box (if you like, you can add other listener attribute’s – but you are best to add them to the other configuration file settings too).

<system.diagnostics>
    <sources>
      <source propagateActivity="true"
              name="System.ServiceModel" switchValue="Warning, ActivityTracing">
        <listeners>
          <add type="System.Diagnostics.DefaultTraceListener" name="Default">
            <filter type="" />
          </add>
          <add name="ServiceModelTraceListener">
            <filter type="" />
          </add>
        </listeners>
      </source>
      <source name="System.ServiceModel.MessageLogging" switchValue="Warning, ActivityTracing">
        <listeners>
          <add type="System.Diagnostics.DefaultTraceListener" name="Default">
            <filter type="" />
          </add>
          <add name="ServiceModelMessageLoggingListener">
            <filter type="" />
          </add>
        </listeners>
      </source>
    </sources>
    <sharedListeners>
      <add initializeData="C:\Logs\LocalServiceTracelog.svclog"
         type="System.Diagnostics.XmlWriterTraceListener, System,
             Version=4.0.0.0, Culture=neutral, PublicKeyToken=b77a5c561934e089"
        name="ServiceModelTraceListener" traceOutputOptions="Timestamp">
        <filter type="" />
      </add>
      <add initializeData="C:\Logs\LocalServiceMessages.svclog"
        type="System.Diagnostics.XmlWriterTraceListener, System,
            Version=4.0.0.0, Culture=neutral, PublicKeyToken=b77a5c561934e089"
        name="ServiceModelMessageLoggingListener" traceOutputOptions="Timestamp">
        <filter type="" />
      </add>
    </sharedListeners>
    <trace autoflush="true" />
</system.diagnostics>
Local Service Settings

Client Application Configuration Settings

Editing the Message Section Within the Configuration Files (Services & Client Application)
Why would you enable the messaging section within the configuration file?.
Basically, you will want to see the user data being (not header information, but the actual serialised class of data for e.g.) posted\received between requests. You can drill down and see the contents that is returned, to verify if the service is returning the correct data or not.
If you look at fig. 5 (remote service) configuration settings, there is a section for messaging called “MessageLogging”. Within this section you can configure what is to be recorded, where and what level is to be tracked. If you click on the “ServiceModelMessageLoggingListener” link to bring up the dialog (fig. 11), you can set the path and the file-name of the log file, again, I have used the same path for all the message logging for handiness, so when I come to viewing them, I just go to one folder, in a production environment this will not be the case, but you can get the message or trace files sent to you to analysis within your trace viewer.
Configure the message level setting by clicking on the “Log Level” link to display the dialog in fig. 12. Here you can set what level of logging you are after, again if you change this, it’s best to be consistent between all the service settings (when it comes to viewing the data in the trace viewer, so that you are able to work through each log file consistently).

Deploying the Services
NB: After you deploy the services, make sure to update your service references within the local service project and within the client application, before running the project.
Right click the remote service and select “Publish” from the context menu to deploy to your “RemoteService” site, fig. 13 will be display, notice that I am not deploying the remote service to the “Default Web Site” as I want to mimic a remote site deployment (all be it on the same server in this case).

Deploying the local service

After deployment of the services you can expand the respective site and view the deployed service. Below (fig. 15) you can see the deployed local service within the “Default Web Site” and the remote service deployed to the “RemoteService” site.

Running the Client Application (thus generating trace & message log files)
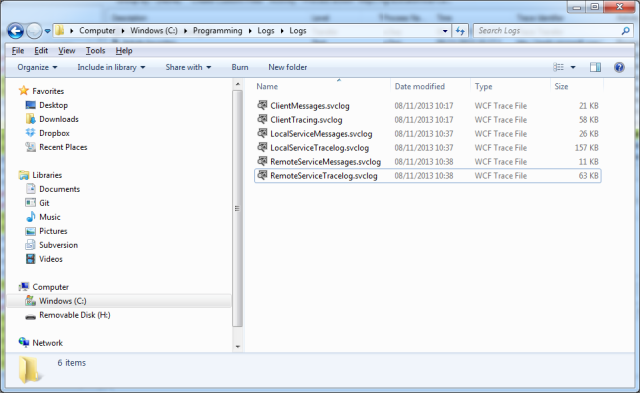
Compile the solution in debug mode (as we will want the PDB files later) and run the application from within Visual Studio or executing the WPF “ClientApp.exe”, to display the main form as in fig. 16. The UI is very basic, in that it contains two group boxes, with buttons that fire of calls to the respective services. The return messages are displayed in the console like box below it. By running through the buttons (top to bottom), you will be creating the trace and log files in the respective location (fig. 22)
Getting Valid Data from local service

Invalid call Local Service

Catching a FaultException from local Service

Call Remote Service valid return

Call remote service method – exception thrown

Catch a remote service fault-exception

How Trace Errors, Warnings and Both are portrayed in Viewer
Just to clarify before opening any trace file, the trace warning are in yellow, the errors will be in red and a service call that has both warning and errors will be in red text with a yellow background (fig. 23).

Examining the Trace Files
First we will have a look and work our way through the trace calls, to find the faults\exceptions within our calls (later we will look at the message logs to verify the data being returned by each service).
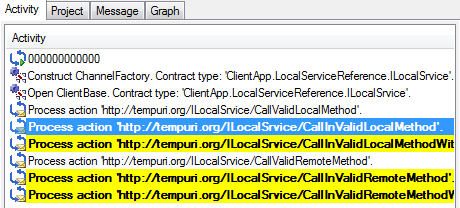
Double click the “ClientTracing.svclog” file to display its trace contents. If you select the Activity pane (fig. 24) and select the first warning (yellow row), which is a call to the “InvalidLocalMethod” on our local service. This service throws back an exception (DivisionByZero) fig. 25 & 26. But if you look at the contents on the right hand side for this activity (by selecting the warning entry), you will not see any reference to the specific exception in the trace details displayed below it. There are exception stack traces, but not detailed enough for us to make a judgment call on what the actual error is.


Fault Exception Returned
If you select the second warning (the call to the “InvalidLocalMethodWirhFaultException” method). And select the warning in the left hand side (fig. 28); you will notice that the FaultException message is visible in the trace details (fig. 29), which is the custom error message the method returns.


Get Exception Message from Local Service
The first exception we couldn't tell what actually was wrong, but if we add in the local service trace log, we will be able to track the call through and back again, and extract the error message. So, drag and drop the “LocalServiceTracelog.svclog” into the activity pane (fig. 30).

Notice now the yellow and red row (fig. 30); this is our invalid call to a local service method “InvalidLocalMethod”, if you select this row to view the trace in the top right hand pane (fig. 31).

Highlight the error row (in red) to display the details of the exception (fig. 32). Notice the actual error now, in red box below – “Attempt to divide by zero”. So now we have found the issue, later I will show you how to debug into your remote code and pinpoint the exact line that is causing the issue. But for now you have quickly determined what the issue is with two click within the Service Trace Viewer.

Service Hopping to Remote Service That returned an Exception
Now we want to see what the exception is on the remote service. In our code, the local service makes a call to the remote service method “InvalidRemoteMethod”, but this method returns an exception. Let’s see what we get with our two trace logs (client and local)!
Select the call to the remote service method, selected in fig. 33, to display the trace details (fig. 34)


Select the warning (yellow) row to display the exception details below (fig. 35). Notice that we get the generic error message coming back to the local service and then to the client.

Let’s now add the remote service trace called “RemoteServiceTracelog.svclog”, by dragging it into the activity pane. The activity pane will have more calls added to it, re select the same warning within activity pane. This time, there is now an exception within the trace details on the top left (fig. 36)

Select that error (red) row, to get the error message (fig. 37) coming back from the remote service, in this case “Attempt to divide by zero”. So now we have traced from the client to the local service to the remote service and found the erroneous methods and its respective exception message.

Tracing Multiple Calls Using the Graph tab
Doing the same thing as above, but using the graph (tab) feature within the trace viewer. With only the trace files in the viewer, you will notice a lot more entries within the Activity pane, it will be in sequential order but there will be a vast amount of data to mull over. To put some sequential sense to this data, it is best to use the Graph pane to coordinate the sequence of calls across each service (starting from the client).
Calling “InvalidLocalMethod” Using the Graph
In the activity pane, highlight the call to the “InvalidLocalMethod” and then select the graph tab to view that entry as a graph (fig. 39)


You will notice the exception icon, if you click on that you will highlight the respective row in the trace details, which in turn will display the exceptions below it. So with the graph you can see all the incoming and outgoing calls in the correct sequence – this is a much easier way to visualise the sequence leading up to the exception.
Understanding the Message Log Tab
With all three trace files loaded, drag on the log file called “ClientMessages.svclog”, to view the data that is being sent over the wire to\from the services. Select the Message tab (fig. 40) and then select the first entry (a call to the “ValidLocalMethod” method) fig. 40. This method does return a serialised class list to the client, which we want to view.

On the right hand trace entrie,s select the “Message Log Trace”row (fig. 41). This will then display the data that was sent back to the client.

Select the XML tab (fig. 42) to view the serialised data going to the client. Here we can view and verify that the details are correct coming from the service call.

Notice there is a blank line below some of the calls (fig. 43); this is the return to the caller.

Tracing the Message Log of an Exception
This time, highlight the call to the method “InvalidLocalMethod” (fig. 44).

Highlight the error (red) row (fig. 45) to display the contents in the viewer below (fig. 46 ) in XML format. Notice the error message “Attempt to divide by zero”.


Debugging into a Remote Service
This approach is best suited for an internal software department, were a team installs the software and has access to the servers and code alike, or a development team that wants to test the production issue in-house by setting up a production environment (as best as possible) or maybe a QA has found an issue that you can’t replicate, so now you are able to debug into that QA’s remote computer and set through to the issue.
To solve this remote debug problem, we can use a small tool called Remote Debugging Monitor (MSVSMON.EXE). It lets you run, debug, and test an application that is running on one device (client machine) from another computer (local development environment) that is running Visual Studio.
For our example, there does need to be some setup prior to debugging your code on a remote server, in our case we will be debugging a remote WCF service. If you don’t already have a home network, I would suggest for this demo, creating a “HomeGroup” network between at two computers within your home environment. A “HomeGroup” can be created in XP or Win7 but OS’s can’t be mixed!
Dedicate one computer as your host and one as your remote computer.
Because we are using a HomeGroup, we can install MSDeploy onto the remote computer, so that you can publish your remote service from your local Visual Studio environment, along with the PDB associated files.
Create a New User Account (remote & local PC’s)
Within the “Computer Management” module, create a new user account called “WcfDebugger” (fig. 47) and give it a password (make a note of the password as you will have to use the same credentials on the host computer).

Add this new user to the administration group( fig. 48).

On the remote computer, because we are using the MSDeploy tool, check if there is a User Group called “MSDepSvcUsers”, if not, create this new user group, add “WcfDebugger” to the user group “MSDepSvcUsers”.
You will need to install the RemoteDebugging software needed, so that the client can attach to the remote computer. This software can be downloaded from here: VS2012 Update 4 or VS2010 Remote Debugger. A good guide on installing the Remote Debugger can be found here.
NB: If your remote computer already has Visual Studio installed (obviously not a production environment), then you already have the RemoteDebugging software installed: check the following location, change to the appropriate version of Visual Studio and framework version:
“C:\Program Files (x86)\Microsoft Visual Studio 10.0\Common7\IDE\Remote Debugger\x64\ msvsmon.exe”
Configure Firewall
Open your firewall (fig. 49) and select the feature “Allow programs through to communicate through Windows Firewall”

You will have to allow “Visual Studio 2012” access through the firewall (if it is not listed, click on the “Add another program” and select Visual Studio 2012, fig. 50 (or the version of VS that your host is using) and click “Add”

Make sure to check the appropriate check-box (if you have created a “HomeGroup” then check the “Home/Work (Private)” check-box fig. 51.
Also make sure that “RemoteDebugger” has access through the Firewall (same settings).

Services
The following Windows Services should have “WcfDebugger” as their start-up user (revert back to original user credentials after testing):
- Visual Studio 10 Remote Debugger
- Web Deployment Agent Service
- Web Management
Start Remote Debugger
After installing the remote debugger software, there should be a desktop link or a start-up to the Remote Debugger application (msvsmon.exe). When you open it, you will be presented with the image fig. 52.

You just need to make sure you have it configured correctly, there isn't much configuration involved, but missing something will not let you debug.
Select “Permissions” by clicking on “Ctrl + P” and allow “Authenticated” security (fig. 53)

Select “Options” by clicking “Ctrl + O” and make sure that “WcfDebugger” is one of the available users (fig. 54).

Click “Apply” and accept the warning message, making sure the “Private Networks” option is checked (fig. 55).

Host Server Setup
- On your host computer, create the same user account with the same password (add to administrator group).
- Visual Studio 2012 (or express) installed on your host computer, from here you will debug into your remote server code.
- Compile the whole solution in “Debug” mode so that the .PDB files are generated.
- Deploy the Remote Service project to the remote computer’s IIS “Default Web Site” (making sure the PDB files are deployed too).
- Update the Local Service project to consume the new remote service.
- Re-compile the local service project.
- Put some breakpoints into your remote service methods (so we know that the code is being hit)
- Within your Visual Studio IDE, select “Debug->Attach Process” and enter the remote PC name (not IP address) including the port number, into “Qualifier”. You can easily find the port number from the Remote Debugger Monitor within the remote PC.

- Click on “Find”, make sure to have the check-box “Show processes from all users” checked.

- Scroll down the available processes running within remote computer and select “ w3wp.exe” and click “Attach” button, you will be prompted by a security warning – click on the attach button.

- You will then notice the remote debugger monitor within the remote PC has been updated with your request to attach to it.

- Because you are using Visual Studio to debug the application, you will have to run the application using the generated executable. Open the “Bin\Debug” folder of the “ClientApp” project and run the application “ClientApp.exe”. Click on one of the remote call methods (one that you have put your break-point in). You should notice your break-point now being hit, and you are able to step through the code as if you were running everything locally within your Visual Studio environment.
NB: The breakpoints, when attached within your IDE, will be solid red circles when running. If they are not, then the remote PDB files are out of sync with your code (recompile and redeploy the remote service).
Testing Remote WCF Services Without Remote Server Intrusion
Introduction
Sometime it’s not possible to install the remote debugger within a production due to customer site restrictions. Then the only option is to actually make calls to the remote service and use the response to determine the erroneous issues. There are a couple of tools out there to make your job easier:
We will use the Remote service that we initially deployed onto the second web site (RemoteService) within our IIS (fig. 56). All we need to test the service is the WSDL URL. I have chosen two popular (free) tools to show you how to test your service without having to write any code and my preference of the two. There are a number of shareware service testing tools on the market, but these two free tools are just as good.
First up is SmartBear’s SoapUI. When you install and open SoapUI for the first time you will get the main form (fig. 57).

From here you will create a project by clicking on “File-New Soap Project” (fig. 58).

Enter the URL to our remote service (in my case http://localhost:81/RemoteService/Services/RemoteService.svc?wsdl) into the second text-box (the project name will be populated by default – but is changeable).
Select the “Create Requests” check-box (fig. 59), this option will create dummy data for you, this might not always be as helpful as you initially think, but I do like the date and time fields to be populated for me (more as a guide to the correct format to use).
You will notice a check-box for “TestSuite”, if you like you can also create a collection of test requests (something I will blog about at a later date) – but a powerful feature for a free tool.
Click “OK” and the progress bar be displayed as the WSDL is interrogated for its signature methods (fig. 60).


Once the WSDL has been parsed, a tree structure will be displayed on the left hand side, this will represent your service methods. If you expand a node, the default name for a call is “Request1”. I often rename this to include the parameters used in the soap request (fig. 61).

If you double click the request for “CallValidMethod”, you will see the soap envelope request on the right hand side along with the result (in our case there are no parameters so the request is sent automatically). But, if we had parameters, we would normally change the parameters and click the run button (fig. 62). In the fig. 63, you will see the response from the service endpoint.


Double click the request for “CallInvalidMethodWithFaultException” and you will see the response on the right hand side(fig. 64) – you will see the hard-coded response we return for the fault exception.
<faultstring xml:lang="en-GB">FaultException from Remote Srvice.</faultstring>

Examining Response of a General Exception
If you run
the request for the method CallInvalidMethod,
you will get the generic response message coming back from the service. This is
where tools like Soap UI fall down, to get more information, you have to
request the administrator of the production site to enable the attribute
“IncludeExceptionDetailInFaults” within the Web.Config file for the service.
The server was unable to process the request due to an
internal error. For more information
about the error, either turn on IncludeExceptionDetailInFaults (either from
ServiceBehaviorAttribute or from the <serviceDebug>
configuration behavior) on the server in order to send the exception information
back to the client, or turn on tracing as per the Microsoft .NET Framework SDK
documentation and inspect the server trace logs.
Passing Parameters with SOAP UI
I added a mthod to take parameters, just to show you the syntax of the request envelope going to the service method (fig. 65). The class structure of the Employee object can be seen along with the string parameter “Name”.

Response from service method (true) after passing in an array of a class object (fig. 66).

NB: You will have to copy & paste the array section to pass in more than one array.
Soap UI Credentials
Often when working against a production site, you need to provide the correct windows credentials for your project to pass through the site security settings, this can be done in the request settings (bottom left) fig. 67.


Creating a Project
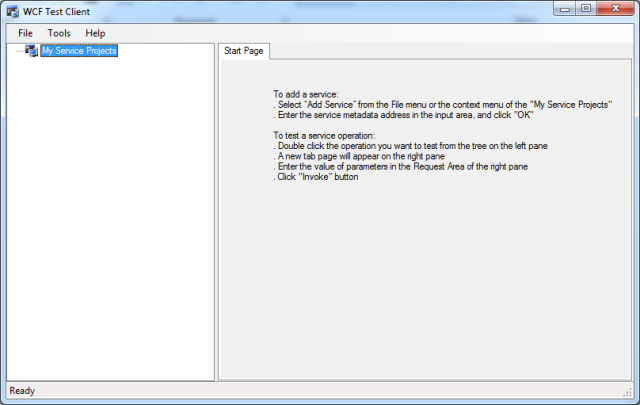
Extract the zip file into a folder and run the file called WcfTestClient.exe. This will open the test client’s main form (fig. 68).
Add the remote service by clicking on “File-> Add Service” (fig. 69).

Enter the same URL to the Remote service as before (fig. 70) and click “OK” the adding progress-bar will be displayed (fig. 71).


Once the addition of service methods has completed, you will see the available methods on the left hand side (fig. 72).

Again you will notice the same methods are displayed as in the Soap UI project, if you double click the method “CallValidMethods” and then click the “Invoke” button on the left hand side (to request the service method) – accept the warning message (fig. 73). And you will see the results of the service call (fig. 74).


Double click on the service method “CallInvalidMethodWithFaultException” and click the “Invoke” button and you will see the error dialog displayed (fig. 75) – you will notice our hard-coded error message “FaultException from remote Service” within the exception itself.

Returning a General Error Message
Double click the service method “CallInvaldMethod” and click the “Invoke” button, to display the generic error message returned by the service (fig. 76). Again if the attribute is set within the Web.config for the service project (on the remote IIS server), you will get a better error message returned.

Passing Parameters to Service Method
I quickly add a method which took parameters within its
signature call called MethodWithParameters – aptly named (fig. 77). Double
click this method to see the right hand pane, which now expects a string and an
array of a custom class (fig. 78).


Notice that the second parameter is expecting an array, currently its length is set to 0.

If you change that to a 1 (fig. 79), and expand the parameter, then click on the value field, it should display a drop-down of the appropriate class (fig. 80). Once selected, you will notice that the class properties are displayed below it.

Fif. 81 is the response for the “Invoke” call – pass back the bool true.

Edit Configuration File (in real time)
You can edit the configuration file (not recommended for production environment). Something I have done this for, is to extend the size of the buffer coming back to the client (fig. 82 & 83).


Conclusion WCF Client Test or SOAPUI
Simply put, I would choose SoapUI, because it will remember the parameters you entered for the requests, when you save the project. WCF Test Client hasa nicer UI for entering array of classes – but it is easy to see how SoapUI works at the end of the day it’s all XML. Plus, you can create a test suite in SoapUI (below I have bullet pointed findings).
- SoaupUI will retain the parameters that you have entered (after saving the project), whereas WCF Test, you will have to re-enter the parameters each time you reopen a service (as you can’t save the service as a project)
- Wcf Test has a nicer UI for entering arrays of data, whereas SoapUI you have to cut and paste (XML) for each array entry.
- SoaupUI calls\exceptions do not show up in Fiddler
- WCF TestClient calls\exceptions will show up in Fiddler