
Code Coverage for Regression Tests (Manual/Auto)
4.44/5 (8 votes)
How to use code coverage during regression tests (auto/manual)
The demo zip contains:
- Code Coverage Sample
WindowsFormsApplication1 CodeCoverageXMLConverterapplication to convert coverage file to XMLBatchFilesCodeCoverageProfillingFiles
Table of Contents
- Introduction
- Regression Tests Code Coverage Implementation
- Conclusion
- References
- Development Environment
- History
Introduction
Code coverage is a utility that seats in Visual Studio Testing Framework. I have used Code Coverage in my previous project to identify which and how much code I have covered in my unit tests.
In that project, we used to have regression tests (Manual/auto) before deploying in production. But Business wanted to know how much code we have covered in regression tests. For that, I used code coverage and generated some nice reports for business as given below. In this article, I am going to tell you how we can use code coverage to instrument DLLs or EXEs during regression tests (manual /auto) and generate reports based on that.
Regression Tests Code Coverage Implementation
First, we need to create a Windows application which we will use for regression tests. Create a simple Windows application with a textbox and 2 buttons as Say Hi and Say Bye. In textbox, we accept name of user. When user clicks on Say Hi button, show message box with text “Hi <<UserName>>”. When user clicks on Say Bye button, show message box with text “Bye <<UserName>>”. As below:

1. Instrument DLLs or EXEs to Test
Open a Visual Studio 2010 or higher Command Prompt (Start | All Programs | Microsoft Visual Studio 2010 | Visual Studio Tools | Visual Studio 2010 Command Prompt)
Change directories to the directory containing windows application EXE as below:
C:\CodeCoverageFinal\WindowsFormsApplication1\WindowsFormsApplication1\bin\Debug
Use vsinstr command for each assembly you wish to instrument.
vsinstr /coverage WindowsFormsApplication1.exe
We can create batch file with name “Instrument.bat” to run the above command, as below:
call "C:\Program Files\Microsoft Visual Studio 10.0\VC\vcvarsall.bat" x86

@echo off

echo Instrumention Started...

pause

vsinstr /coverage C:\CodeCoverageFinal\WindowsFormsApplication1\
          WindowsFormsApplication1\bin\Debug\WindowsFormsApplication1.exe

echo Instrumention Completed.

pause
Run “Instrument.bat” file, a command prompt will show up as below:

As shown in the above screen application, EXE is instrumented and WindowsFormsApplication1.instr.pdb file is created.
Note: This is a one time process. If you make changes in the solution, then delete all PDB files, then again run the
“Instrument.bat” file.
Start Code Coverage Monitor
To start our test run, we need to spin up the code coverage monitor. We do this by running vsperfcmd command from the Visual Studio 2010 Command Prompt.
vsperfcmd /start:coverage /output:[AMeaningfulOutputName].coverage
Example
vsperfcmd /start:coverage /output:c:\Test\RegressionTests.coverage
/output– outputs the result to specified file
We can create batch file as “Start_Profiler.bat” to run the above command as below:
call "C:\Program Files\Microsoft Visual Studio 10.0\VC\vcvarsall.bat" x86

@echo off

echo Starting Profiler...

pause

vsperfcmd /start:coverage
/output:C:\CodeCoverageFinal\CodeCoverageProfillingFiles\RegressionTests.coverage

echo Started Profiler.

pause
Run “Start_Profiler.bat” file, a command prompt will show up as below:

As shown in the above screen, profiler has started and it is recording in the C:\CodeCoverageFinal\CodeCoverageProfillingFiles\RegressionTests.coverage file.
3. Run Application
You start your application by running it from a specific location.
Example
C:\CodeCoverageFinal\WindowsFormsApplication1\WindowsFormsApplication1\
   bin\Debug\WindowsFormsApplication1.exe
4. Regression Tests (Manual/Auto)
Here, we run all manual/auto test cases.
For our demo, click on any or both buttons.
5. Stop Application
Shut down your app the way a user normally would.
6. Stop Code Coverage Monitor
We need to shutdown the code coverage monitor. This will cause the code coverage data to be written out to the file that we specified on the command-line in Step 2. Do this by running vsperfcmd command in the Visual Studio 2010 Command Prompt.
vsperfcmd /shutdown
For web services/web application worker process, (aspnet_wp) is created which is still running above command waits for worker process. We need to kill worker process before the above command. So use iisreset to kill worker process.
We can create batch file “Stop_Profiler.bat” for the same as below:
call "C:\Program Files\Microsoft Visual Studio 10.0\VC\vcvarsall.bat" x86

@echo off

echo Stopping Profiler...

pause

iisreset

vsperfcmd /shutdown

echo Stopped Profiler.

pause
Run “Stop_Profiler.bat” file below prompt shows:
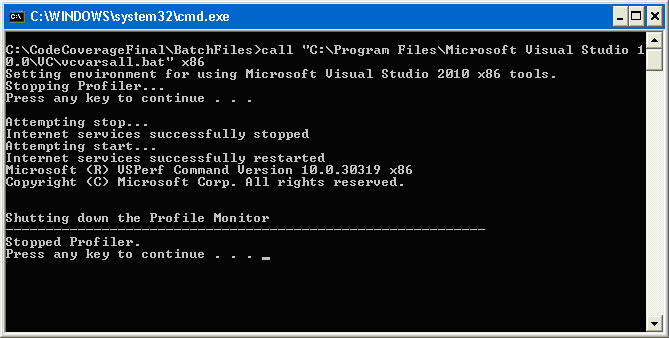
As shown in the above screen, profiling has been stopped and our coverage file is populated.
7. Review Code Coverage File
To look at the code coverage results, open the .coverage file (specified on the command-line in Step 2) in Visual Studio 2010 or higher. If someone looking at the .coverage file has access to the source code, they will be able to see the source code coloring. This file will be very helpful to developers.
Open the “RegressionTests.coverage” file in Visual Studio, you will get details as below:

8. Report Generation
Use CodeCoverageToXMLConvertor application to get XML report as below:


Now you will find C:\CodeCoverageFinal\CodeCoverageProfillingFiles\RegressionTests.coverage.xml file. This file contains many sections and gives detailed information for code coverage. I have created an XSLT file "myxml.xsl" to generate report based on business requirement. You can include more sections as per your requirements. you just need to update "myxml.xsl" file.
Edit this XML file and add below line at 2nd line.
<?xml-stylesheet type="text/xsl" href="myxml.xsl"?>
Open this file in Internet Explorer, you will get a nice report for business as below:

Similarly, we can profile many files at a time to generate a complete report.
Conclusion
This article presented how to use code coverage during regression tests (auto/manual).
References
- Running Tests with Code Coverage
- MSDN: Manual Test Overview
- Perform Code Coverage Analysis with .NET to Ensure Thorough Application Testing (MSDN Magazine)
- MSDN - VSInstr
- MSDN - VSPerfCmd
- Code Coverage For Manual Tests by Steven Jean
- Running Tests with Code Coverage
- Off Road Profiling of ASP.NET Applications
Development Environment
VS Team System 2010 Development Edition/ Visual Studio Team System 2010 Test Edition/Visual Studio Team System 2010 Team Suite. Or higher version of Visual Studio.
History
- 9th May, 2013: Original article
- 13th May, 2013: Updated some sections
Note: Please do read, bookmark, comment, vote article.