
Solution: Visually Inspect Backbone.js View/Templates + Application Logging Support
0/5 (0 vote)
Solution: Visually Inspect Backbone.js View/Templates + Application Logging Support
During the development of a fairly large JavaScript-based web application using Backbone.js, it became increasingly difficult to manage the numerous View.js and Template.js files. Those familiar with Backbone MVC design approach have probably also encountered this. Best practice for an MVC user interface is to decompose it into many snippets made up of a controlling Backbone View, an HTML template, and a Model/List . Each of these elements are defined into their own JavaScript file.
As the application grew, the Views grew. Trying to determine which View and Template was responsible for a particular UI area was confusing. View naming conventions and logically grouping files helped some, but it still took some hunting and pecking to find the right view or template to make a change.
Our Creation
To solve this problem, we created a JavaScript UI Inspector and Logging library. It allows you to quickly identify and inspect JavaScript files during development, as well as provides logging support.
This inspector library outlines a UI View/Template boundary on MOUSE OVER. When the area is double-clicked, it displays the View/Template name and optional model (JSON) for the View element. An example of this is shown in the screenshot below. The library outlines the View element in red on mouse over.

The View Inspector is toggled by hitting CTRL-ENTER.
We’ve opened-sourced this library on GitHub (at https://github.com/in-the-keyhole/khs-logger), and it has numerous configuration options.
This library is AMD compatible, so it can be loaded using a <script> tag, or as a Require.js module. It is applied to Backbone Views using a mark() method that requires the EL, along with the View/Template name, and optional JSON model object. jQuery is the only dependency, so when loaded, we attached a single instance to it. Library attributes and methods are accessed with $.Log.<attribute/method>. Enabling View Inspecting is turned on with the following expression:
$.Log.inspect(); // done once at application start
Views are marked for inspection by applying the following expression in a Backbone View render method. The expression is highlighted below:
return Backbone.View.extend({
    tagName: 'p',
    render: function (eventName) {
        var compiled_template = _.template(Template);
        var $el = $(this.el);
        $el.html(compiled_template(this.model.toJSON()));
        $.Log.mark($el, "categoriesPaneRefView.js -> category-tab-pane-ref.html",
                              this.model.toJSON()); // Mark for inspector...
        return this;
    },
});
Of course, this could be generalized further to avoid having developers litter up View.js files with this code. However, it’s arguable on what kind of value this provides the developer. For large projects with a multitude of Views, we’ve found it helpful. So we added an extension feature to the visual Inspector.
Custom Inspectors can be installed to display “Inspect” for additional information. An Inspector is a function closure that will be executed and supplied with a View’s jQuery EL value. The returned HTML from the Inspector will be displayed in the pop-up UI inspector. Here’s a simple example Hello World Inspector implementation:
// install hello world inspector.
$.Log.install(function (el) {
    return "Hello World, there are " + el.children().length + " elements";
});
Here’s a screen shot of how it looks, when invoked:

The library also has application logging features that we’ll talk about in the next section.
Logging Support
If you are building an application that has heavy usage, logging can provide useful troubleshooting and performance diagnostics. It can also provide a way to intercept Log expressions for other purposes, such as sending error Log statements to a remote URL.
Most browsers provide console logging using the console.info(), console.debug(), etc. APIs. However, the format of the Log statements (i.e., date/time) is determined by the developer that is applying the Log. Additionally, viewing Log statements is dependent upon the browser. For instance, Internet Explorer only provides console Log support if developer tools have been installed.
The View Inspecting Library also has robust Log support. Once the library is loaded, Log expressions can be expressed (where appropriate) in your application code, as shown below:
$.Log.info("Info expression...");
$.Log.debug("Debug expression...");
$.Log.error("Error expression...");
Expressions in the output will be prefixed with date/time:
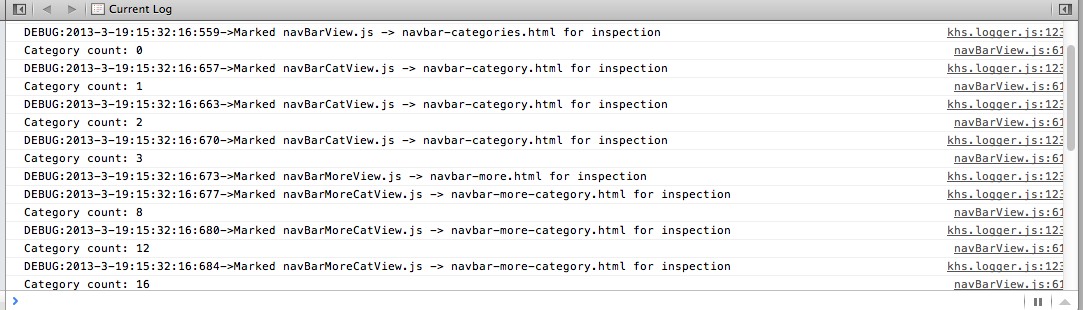
Log levels can be set to filter out unwanted Log statements:
$.Log.level = $.LogLevel.debug;
Additionally, a remote RESTful Log URL can be specified. Then, Log statements will be sent to this URL for server side processing.
Here’s an example that turns remote logging on, creating an error handler so that all errors are logged to the server:
	// Remote logging URL and level
	$.Log.remoteUrl = "sherpa/log";
	$.Log.remoteLevel = $.LogLevel.error;

	 // Log all errors to server
	window.onerror = function (message, url, linenumber) {
	    $.Log.error(message + "line:" + linenumber + "url:" + url);
	};
The library also supports logging to local storage. This can be useful when attempting to diagnose user issues. The number of Log records saved to local storage by default is 100, however this can be configured. It’s simply turned on as follows:
// turn on local storage logging
$.Log.logLocal = true;
Logs are stored as a JSON string and can be retrieved or reset with the following expressions:
$.Log.localLogEntries(); // returns Local Storage Log Entries as JSON
$.Log.resetLocalLog(); // resets local storage log
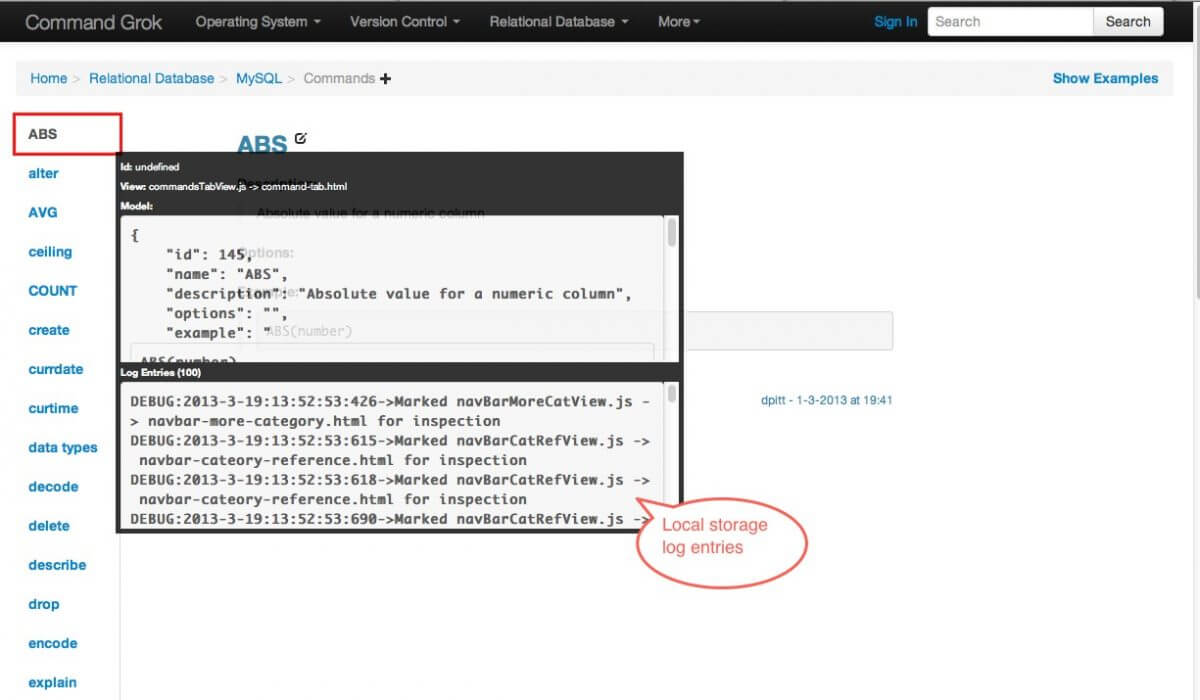
The View Inspector feature can be used to display local logging expressions through the UI. Just install the provided local logging inspector, applied like this:
// Install local logging inspector
$.Log.install($.Log.localStorageLogInspector());
Here’s a screen shot of a View Inspector displaying local storage Log entries:
Conclusion
This logging library has been open-sourced on GitHub at https://github.com/in-the-keyhole/khs-logger. Definitely check it out for more details on installation and usage. We hope that you find this tool useful!
– David Pitt, asktheteam@keyholesoftware.com