
Introducing Business Intelligence Reporting to a Software System, a Jasper Reports How-to
0/5 (0 vote)
Introducing business intelligence reporting to a software system
Most software development teams spend all of their time and efforts gathering requirements, planning, testing, implementing and supporting large systems to be able to do the one thing they are all in business to do: make money!
Rightfully so, the core efforts of their business and development teams need to focus on making the software work for their business and their customers. What usually gets overlooked (and pushed to the back burner) is the value sitting in the data. The data collected and generated by software systems is invaluable to businesses. It can help them be more profitable. It can help them understand their customers better. Heck, it can even help them understand themselves better. But, how do you get to that data?
The idea of Business Intelligence brings all of this data to light. In theory, getting the right data in the hands of empowered people is when real positive change can occur. But where do you start? What software systems are available? What will work with your technology base and infrastructure? There are many choices in the market that are both free and paid.
The open source Jasper Reports framework has been around for years. It is a Java-based reporting engine that allows users to create visual reports based on any accessible data source. Being Java-based allows it to easily integrate into existing desktop or web-based Java systems.
I think another commonly-overlooked benefit of Jasper Reports is that because it is Java, businesses and organizations can use their existing development teams and current development processes to get reporting integrated quickly. The ramp-up time to learn the tool is minimized — a huge benefit.
The Reporting Platform
The folks at JasperSoft have a few offerings related to the reporting platform, but for this basic introduction, we are going to focus on only two of them.
The first piece is the Jasper Reports framework. It is the heart of the whole system. The framework can take a report, connect to a datasource (e.g., a relational database, an XML file, etc.), fill the report with data and then export it to a given format (HTML, XLS, DOC and CSV to name a few). This is the simplified description of what the framework can do.
The second piece is iReport. iReport is the desktop tool (available for both Mac and PC) that users use to create the reports themselves. It is built and designed around a WYSIWYG approach where elements are dragged and dropped into the body of the report. Users can move elements around in a pixel-by-pixel fashion to get the report to look exactly how they want it. It will be the job of the Jasper Reports framework to figure out how to get that look-and-feel achieved in PDF, HTML, Word, etc. All users have to do is design the report one time, in iReport, and the Jasper Reporting framework will do all of the rest.
Under the covers, the file(s) created by iReport are simply XML files (with a .jrxml file extension) meeting the Jasper Reports specification. You actually don’t need iReport to build a report, but without it, you would have to know the XML schema and build it by hand. iReport is a visual interface to building that XML, alleviating the users from ever having to know the specific details. But knowing them won’t ever hurt!
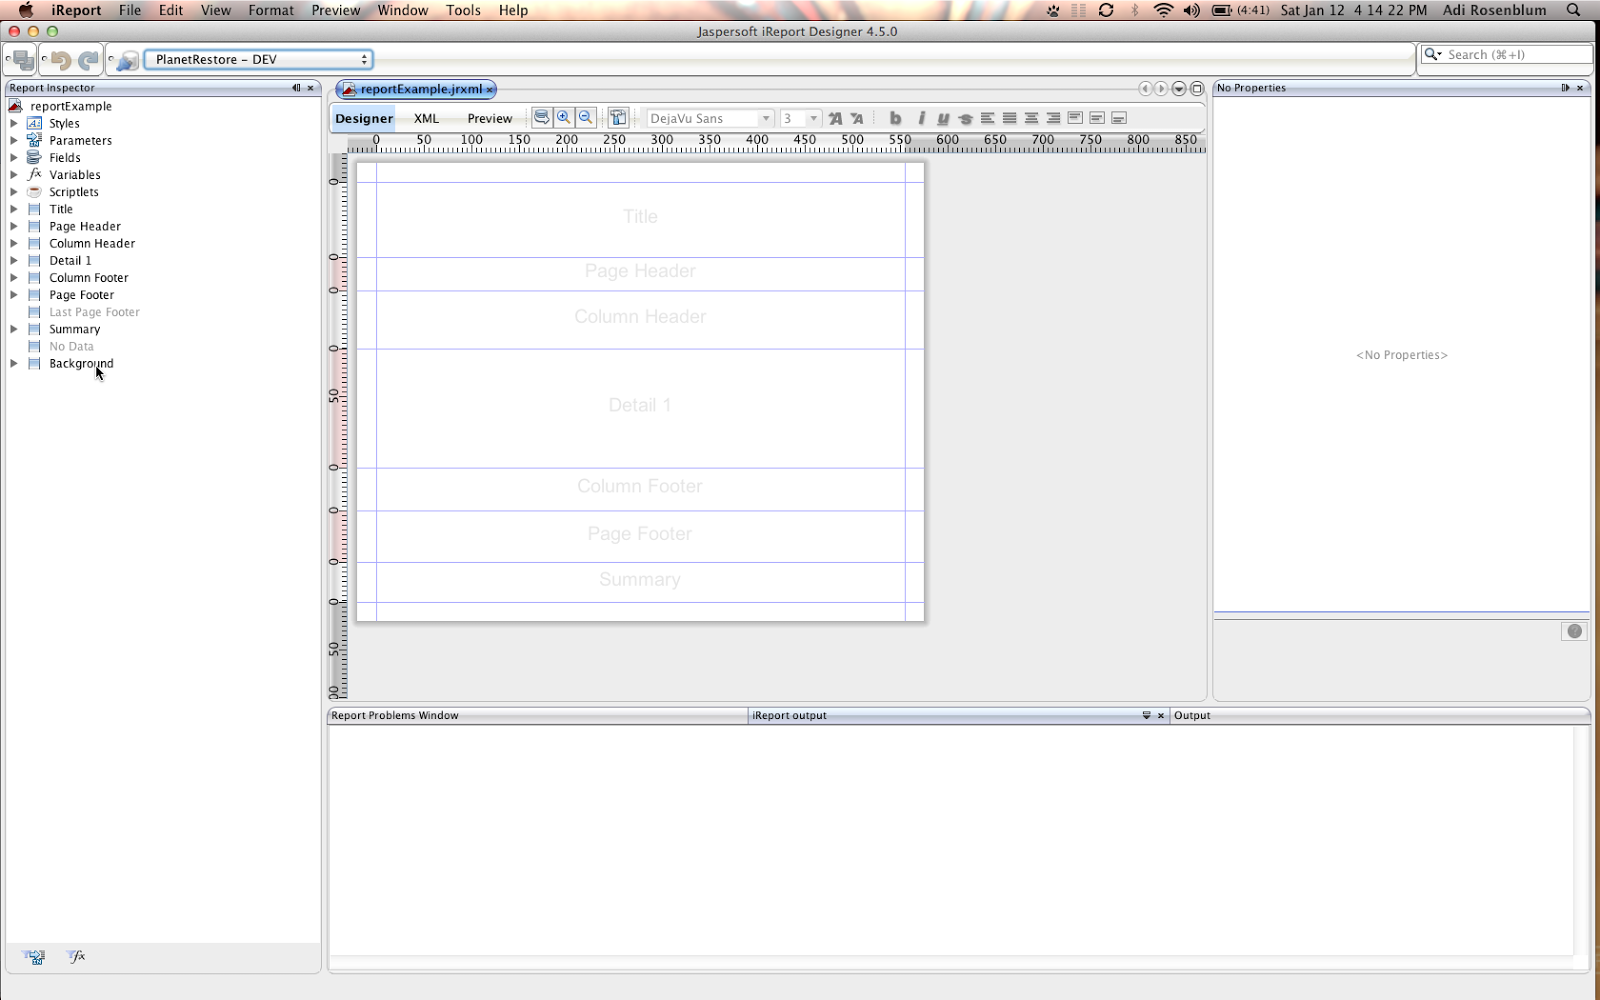
iReport
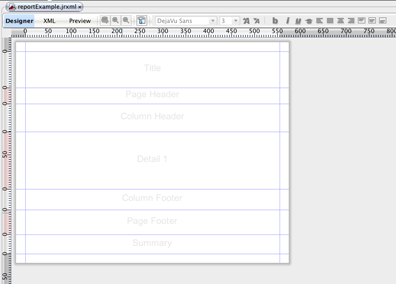
You can download iReport for free, since it is distributed under the AGPL license. Once downloaded and extracted (and a new blank report is created), you should see a view like this:
Setup
iReport can acquire data from many different sources. For this example, we’ll use a relational database and write an SQL query to get the data for our report. The first step is to configure iReport for this database connection.
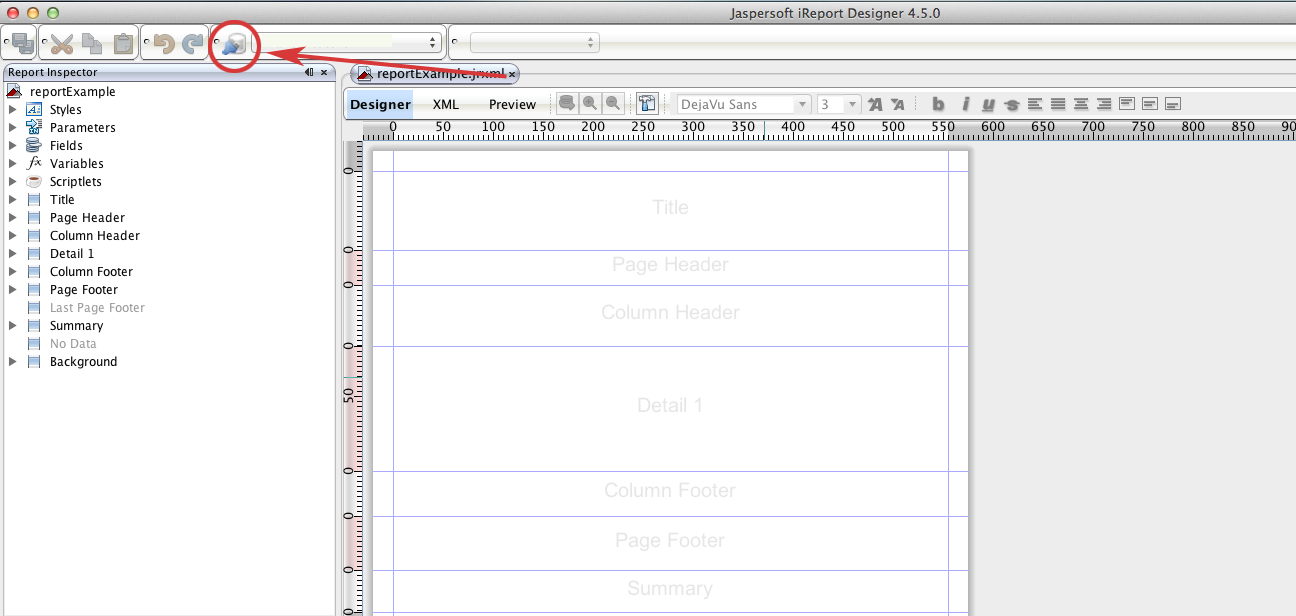
- On the main toolbar, click on the Report Datasources button:
- In the Connections/Datasources window, click the “New” button on the right side.
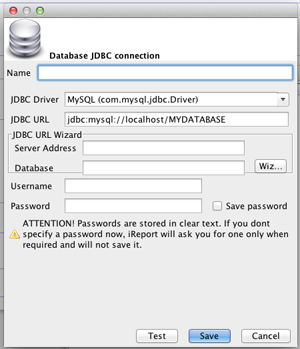
- Select Database JDBC Connection as the connection type and click “Next.”
- You should now see a dialog like this:
- Fill out the fields as follows:
- Name: Provide a name for this connection that makes sense to you.
- JDBC Driver: Select the type of database/driver for your application from the dropdown list. If your driver type is missing, you can add it to the list by adding the driver’s jar file onto the iReport classpath and restarting.
- JDBC URL: Fill out your server name and database name as necessary in the URL pattern.
- Username: Enter the username to use for the connection.
- Password: Enter the plain text password to use for the connection.
- Click the “Save Password” text box if you don’t want to have to retype your password every time you open iReport and connect to this database.
- Click the “Test” button to make sure your connection works properly.
- Click the “Save” button to finish.
You should now see your new connection displayed in the dropdown list to the right of the Report Datasources button. Whichever connection is selected in that list is the connection that iReport will use when you Preview your report. Changing databases is as simple as changing the selected item in that dropdown!
Creating and Editing Reports
There are three main areas of the editor to focus on:
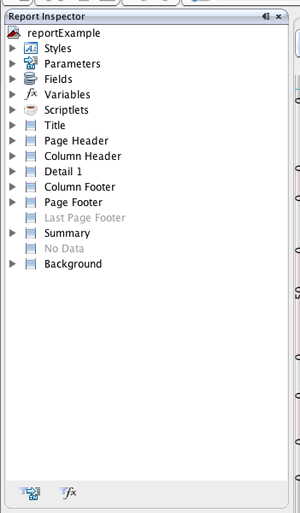
- Report Inspector – This is a tree-like view of the structure of the report. You should see styles, parameters, variables, fields, scriptlets and then a list of “bands.”
- Parameters: These are used to capture values from users and are accessible by the report to use in SQL queries, etc. One basic example of a parameter may be a date (or a date range) for which the user wants to see data.
- Variables: Similar to writing cell-based formulas in Excel, Variables can calculate a value based on how they are setup. There are many calculation types, but the most common are Sum, Count, Average, etc. A few built-in Variables already exist, such as: the current page #, total number of pages, current row #.
- Fields: If you are using an SQL statement to gather your data (the most common scenario), the Fields represent a list of columns coming back from the database. The Fields are what actually get displayed on your report at the end. Once you enter a query into the SQL window, iReport will generate Fields for you by connecting to the database and seeing what columns are returned by your query.
- Bands: A band is a virtual container for Report Elements. The elements you drag and drop into a band are the things that will display data on your report. There are many bands available, but you can choose which bands are necessary for your report and add/delete them at will. Each band has its own purpose:
- Title: Shows up once at the top of the first page of your report
- Page Header/Footer: They show up at the top/bottom of each page of your report (the # of pages is usually determined by the number of rows in your resulting dataset).
- Column Header/Footer: They show up before/after the data section of your report.
- Detail: This is a special band that behaves differently than all other bands. The detail band is repeated for each and every row in your query’s result set. So if your query brings 100 rows back from your datasource, then the detail band will be printed 100 times in a row.
- Editor Area – This is where your report is displayed. You can see all the bands of your report and any elements you have dragged and dropped into them.
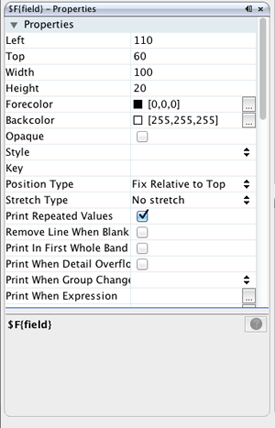
- Properties View – This view changes to show the properties of whatever element is selected in either the Report Inspector or in the Editor area. Here you can easily see the size (height and width), position (top and left distances from the edge of the band), font settings and more.
Now that you have iReport installed, configured and know the main areas to focus on, you can start building your report.
You should probably begin by entering your SQL statement into the report. To do this, click on the “Report Query” button on the toolbar:
In the “Report Query” window, type in your SQL statement under the “Report Query” tab.
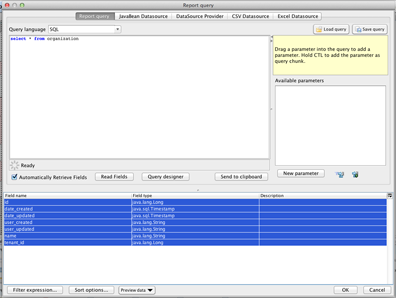
Below your query, you should see a list of “Fields” that iReport generated based on the columns your query returns. When everything looks okay, click the “OK” button to save and close your query.
Look in the “Report Inspector” under the “Fields” node. Expanding that node should show you all the Fields you just saw in the Report Query window. Drag and drop one of these fields onto the “Detail” band of your report. You should now see something like this:

iReport just did two things for you:
- Created a Static Text element with the name of your field in it, and placed it into the Column Header band.
- Created a Text Field element for your field and placed it into the Detail band where you dropped it.
Make no mistake here, these are two separate and distinct elements. You can move them independently and edit or delete them independently.
Now, let's move them to the top left corner. You can do this by either dragging them with your mouse, or by clicking on one and editing its properties (setting the Top and Left values to zero).
Now repeat this process for other fields that you wish to display in your report. Here is what my report looks like now:

I took the liberty of renaming the column headers (double click on one, type a new value and hit “Enter” on your keyboard), bolding them (using the button on the toolbar) and positioning them so they are all next to each other. Things are starting to look better, but we have a lot of extra white space here. Let's set the height of our bands to match our elements so that everything gets tightened up.
We need to adjust both the column header and detail bands. Click each, one at a time, in the Report Inspector. With the band selected, go to the “Properties View” and set its height to 20. When done, right click on the Column Footer and delete it (we don’t need it for now). Also, delete the Page Header, Summary and Background bands. Set the height of each remaining band to 20 as well. You should have something like this now:

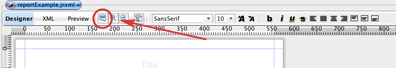
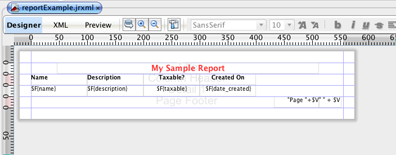
Our bands are nice and clean and we are displaying some fields across the width of the report. The only things left for our simple example are a Title and some Page Footer information. Drag and drop a Static Text element from the Palette into the “Title” band, position it to your liking, and enter the title of your report. Style the element by setting its font settings to your liking.
Next, go to the Palette and drag and drop the “Page X of Y” element to your page footer. Move the elements to whichever side of the band you like. Now you should see something like this:
Now, we are ready to run our report and see what it looks like. This part is easy, simply click the “Preview” button on the toolbar:
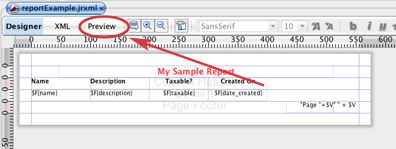
iReport will connect to your database, run your query, assemble your report and display it for you all in one step. Here is my report in preview mode:
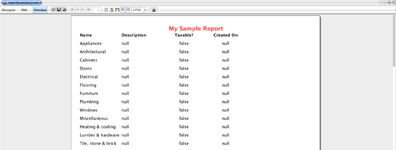
If you notice, one of my columns had no data in it, so I see a list of “null” values. This isn’t very user friendly, so I’m going to ask iReport to help me. Toggle yourself back to Design mode by clicking the “Designer” button on the toolbar (two buttons to the left of the “Preview” button).
In the “Detail” band, click to select the element in the column with null values. In the “Properties View,” click the “Blank when null” checkbox. iReport will now leave that column empty instead of displaying the word “null” repeatedly. I have done this to two of my columns and now my report looks like this:
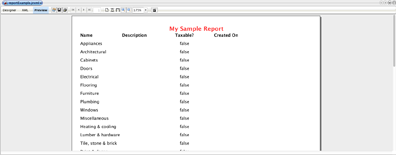
Things are looking much better, and for this example, we have what we need to proceed and get the integration going into our existing Java application.
Integration
Getting Jasper Reports into your existing Java application is easier than you think. Download and extract the Jasper Report framework and add the required jars to your project’s classpath.
Make a new folder in your codebase and copy the report’s .jasper file (created by iReport) into it.
Jasper Reports provides you some tools to load the report from a given location. Use the JRLoader object and select the method that suits you best. Here are a few common examples:
package com.keyholesoftware.example.jasperreports;

import java.io.*;

import net.sf.jasperreports.engine.*;
import net.sf.jasperreports.engine.util.*;

public class JasperReportLoader {

	/**
	 * Load a report from a specific (absolute) file path
	 *
	 * @return
	 */
	public JasperReport loadReportFromFile() {
		JasperReport result = null;

		try {
			File myReport = new File("/reports/myReport.jasper");
			result = (JasperReport) JRLoader.loadObject(myReport);
		} catch (JRException e) {
			e.printStackTrace();
		}

		return result;
	}

	/**
	 * Load a report from the classpath
	 *
	 * @return
	 */
	public JasperReport loadReportFromInputStream() {
		JasperReport result = null;

		try {
			InputStream is = getClass().getResourceAsStream("myReport.jasper");
			result = (JasperReport) JRLoader.loadObject(is);
		} catch (JRException e) {
			e.printStackTrace();
		}

		return result;
	}
}
There are many more ways to load your report, but this gives you a quick and dirty way. In the end, you just need an instance of a JasperReport object.
Once you have acquired that report, the next step is to fill it with data and generate a JasperPrint object. This object is what we need to export the report to a specific format (PDF, XLS, HTML, etc.).
package com.keyholesoftware.example.jasperreports;

import java.sql.*;
import java.util.*;
import java.util.Date;

import net.sf.jasperreports.engine.*;

public class JasperReportService {

	public JasperPrint fillReport(JasperReport report) {
		JasperPrint result = null;

		try {
			// acquire a database connection for my report to use
			Connection myDatabaseConnection = DataSourceService.getConnection();

			// optionally pass some parameters to my report
			Map<String, Object> parameters = new HashMap<String, Object>();
			parameters.put("myParameter1", 1);
			parameters.put("myParameter2", "some value here");
			parameters.put("myParameter3", new Date());

			// Fill the report and generate a JasperPrint object
			result = JasperFillManager.fillReport(report, parameters, myDatabaseConnection);
		} catch (JRException e) {
			e.printStackTrace();
		}

		return result;
	}
}
The example above shows how to combine a Map of parameters and a database connection to fill the report with data. Again, there are many options of how to fill your report, but this is a good basic and straightforward example. Look at the JasperFillManager to see other ways you can fill your report.
Now that we have a JasperPrint object created from our report, we can use it to export our report to a format of our liking. Here are a few common examples:
package com.keyholesoftware.example.jasperreports;

import java.io.*;

import net.sf.jasperreports.engine.*;
import net.sf.jasperreports.engine.export.*;

public class JasperReportExporter {

	public String exportToHTML(JasperPrint jasperPrint) {
		String result = null;

		try {
			JRHtmlExporter htmlExporter = new JRHtmlExporter();

			// setup the exporter
			htmlExporter.setParameter(JRExporterParameter.JASPER_PRINT, jasperPrint);
			OutputStream os = new ByteArrayOutputStream();
			htmlExporter.setParameter(JRExporterParameter.OUTPUT_STREAM, os);

			// do the work
			htmlExporter.exportReport();

			result = os.toString();
		} catch (JRException e) {
			e.printStackTrace();
		}

		return result;
	}

	public byte[] exportToPDF(JasperPrint jasperPrint) {
		byte[] result = null;

		try {
			result = JasperExportManager.exportReportToPdf(jasperPrint);
		} catch (JRException e) {
			e.printStackTrace();
		}

		return result;
	}

	public byte[] exportToXLS(JasperPrint jasperPrint) {
		ByteArrayOutputStream result = new ByteArrayOutputStream();

		try {
			JRXlsExporter xlsExporter = new JRXlsExporter();

			// setup the exporter
			xlsExporter.setParameter(JRExporterParameter.JASPER_PRINT, jasperPrint);
			xlsExporter.setParameter(JRExporterParameter.OUTPUT_STREAM, result);

			// set some optional parameters for this specific exporter
			xlsExporter.setParameter
			(JRXlsExporterParameter.IS_ONE_PAGE_PER_SHEET, Boolean.FALSE);
			xlsExporter.setParameter
			(JRXlsExporterParameter.IS_DETECT_CELL_TYPE, Boolean.TRUE);
			xlsExporter.setParameter
			(JRXlsExporterParameter.IS_WHITE_PAGE_BACKGROUND, Boolean.FALSE);
			xlsExporter.setParameter
			(JRXlsExporterParameter.IS_REMOVE_EMPTY_SPACE_BETWEEN_COLUMNS, Boolean.TRUE);
			xlsExporter.setParameter
			(JRXlsExporterParameter.IS_REMOVE_EMPTY_SPACE_BETWEEN_ROWS, Boolean.TRUE);

			// do the work
			xlsExporter.exportReport();
		} catch (JRException e) {
			e.printStackTrace();
		}

		return result.toByteArray();
	}
}
Conclusion
There are many options for each export type, but again, this gives you some good basic examples of HTML, PDF and XLS formats. Now your code can take these results and do with them what you wish. Email them, write them to disk or you can take the exported HTML string and put it on a web page in your Java-based web application.
JasperReports is a very mature reporting framework with literally thousands of options and features. I have just touched the surface to show you how to get started with integrating a reporting framework into your system. Follow up blog posts will cover more advanced report writing topics, as well as advanced report execution procedures, performance tweaks and memory saving tips. Stay tuned!
Also, the examples featured in this article can be downloaded here:
- Java Code (the zipped up Eclipse project containing sample code)
- Report file (a .jrxml file)
– Adi Rosenblum