
.NET Best Practice No: 1:- Detecting High Memory consuming functions in .NET code
4.81/5 (42 votes)
.NET Best Practice No: 1:- Detecting High Memory consuming functions in .NET code
.NET Best Practice No: 1:- Detecting High Memory consuming functions in .NET code


Introduction and Goal
One of the important factors for performance degradation in .NET code is memory consumption. Many developers just concentrate on execution time to determine performance bottle necks in a .NET application. Only measuring execution time does not clearly give idea of where the performance issue resides. Ok, said and done one of the biggest task is to understand which function, assembly or class has consumed how much memory. In this tutorial we will see how we can find which functions consume how much memory. This article discusses the best practices involved using CLR profiler for studying memory allocation.
Thanks a lot Mr. Peter Sollich
Let’s start this article by first thanking Peter Sollich who is the CLR Performance Architect to write such a detail help on CLR profiler. When you install CLR profiler do not forget to read the detail help document written by Peter Sollich.
Thanks a lot sir, if ever you visit my article let me know your inputs.
CLR Profiler to rescue
CLR profiler is a tool which helps to detect how memory allocation happens in .NET code. CLR profiler tool is provided by Microsoft, you can download the same from
http://www.microsoft.com/downloads/details.aspx?familyid=A362781C-3870-43BE-8926-862B40AA0CD0&displaylang=en .
Note :- There are two version of CLR profiler one for .NET 1.1 and the other 2.0 framework. For 2.0 CLR profiler you can visit http://www.microsoft.com/downloads/details.aspx?familyid=A362781C-3870-43BE-8926-862B40AA0CD0&displaylang=en and to download 1.1 you can use http://www.microsoft.com/downloads/details.aspx?familyid=86ce6052-d7f4-4aeb-9b7a-94635beebdda&displaylang=en#Overview
Once you download CLR profiler you can unzip and run ‘CLRProfiler.exe’ from the bin folder.
If you have downloaded 2.0 CLR profiler it provides executables for ‘X86’ and ‘X64’ environment. So please ensure to run the appropriate versions.
Features of CLR profiler
CLR profiler is the best tool when it comes to understanding how memory allocations are done in .NET application code. It does two prime importance functions:-
• Gives a complete report of how memory is allocated in a .NET application. So you can see full report how memory is allocated as per data types, functions, methods etc.
• It also provides how much time the method was called.

Do not user CLR on production and as a starting tool for performance evaluation
CLR is an intrusive tool. In other words it runs its own logic of dumping memory values for every function / class / modules inside the application. In other words it interferes with the application logic. Let’ say you have a normal application which calls function 1 and function 2. When you profile your application with CLR profiler it injects dumping of memory heap data after every function call as shown below.

In other words do not use CLR profiler to find execution time of your application. It actually slows down your application 10 to 100 times. You will end up with wrong results.
As said because it’s an intrusion tool you should never use the same in production environment.
First thing you should never first start analyzing your performance issues by CLR profiler tool. It’s more of a second step activity where you have zeroed on a function or a class which is having memory issues. So probably you can use performance counters to first find which methods and functions take long execution time and then use CLR profiler to see how the memory allocations are done.
How can we run CLR profiler?
One you have downloaded the CLR profiler from Microsoft site, unzip the files in a folder. Go to the unzipped folder in Binaries à choose your processor and run ‘CLRProfiler.exe’. You will be shown the CLR profiler as shown in the below figure.
The first step we need to decide what do we want to profile. There are two things one is the memory allocation and the other is number of calls to a method. So select what data you want to profile and then click start application.

Once you are done you can see the complete summary of profiling as shown below. It’s a very complicated report we will see a simplistic approach when we profile the sample application.

Issues faced by CLR profiler
Some issues we faced while running CLR profiler. If you are getting the below screen and it does not stop, there can be two reasons:-
• You have .NET 2.0 and you are running CLR profiler 1.1.
• You have not registered ProfilerOBJ.dll in GAC.

The sample application we will profile
The application which we will profile is pretty simple. It has a simple button which calls two functions ‘UseSimpleStrings’ and ‘UseStringBuilders’. Both these functions concatenate strings. One uses ‘+’ for concatenations while the other uses the ‘StringBuilder’ class. We will be 1000 times concatenating the strings.
private void UsingSimpleStrings()
{
string strSimpleStrings="";
for (int i = 0; i < 1000; i++)
{
strSimpleStrings = strSimpleStrings + "Test";
}}
The function which uses ‘StringBuilder’ class to do concatenation.
private void UsingStringBuilders()
{

StringBuilder strBuilder = new StringBuilder();
for (int i = 0; i < 1000; i++)
{
strBuilder.Append("Test");
}
}
Both these functions are called through a button click.
private void btnDoProfiling_Click(object sender, EventArgs e)
{
UsingSimpleStrings();
UsingStringBuilders();

}

Using CLR profiler to profile our sample
Now that we know our application we will try to use profiler to see which function uses how much memory. So click on start application à browse to the application exe and click on check memory allocation button and close the application. You will be popped up with a complete summary dialog box.
If you click on histogram button you can see memory allocations as per data type. I understand it’s very confusing. So leave this currently.

If you are interested to see how much memory is allocated as per functions you can click on ‘Allocation Graph’. This gives as per every function how much memory is consumed. Even this report is very confusing because so many function, so many methods and we are not able to locate our two functions of string ‘UsingStringBuilders’ and ‘UsingSimpleStrings’.

To simplify the above graph right click and you will be popped with lot of filtering options. Let’s use the ‘Find Routine’ search to filter unnecessary data. We have entered to get the button click event. From this button click those two functions are called.
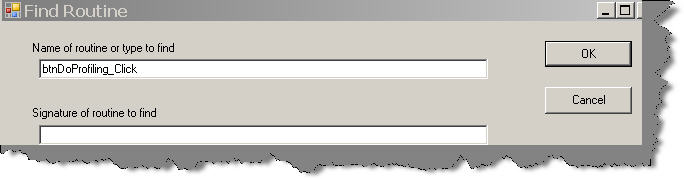
The search now zooms on the method as shown in the below figure. Now double click on the ‘btnDoProfiling_Click’ box as highlighted in the below figure.

After double click you will see the below details. It’s now better. But where did the second function go off. It’s only showing ‘UseSimpleStrings’ function. This is because the report is coarse. So click on everything and you should see all the functions.

You can now see the other function also. What’s the 26 bytes ?. It’s just an extra string manipulation needed to when the functions are called, so we can excuse it. Let’s concentrate on our two functions ‘UseSimpleStrings’ and ‘UseStringBuilders’ can now be seen. You can see string concatenation takes 3.8 MB while string builder object consumes only 16 KB. So string builder object is consuming less memory than simple string concatenation.

That was a tough way any easy way
The above shown way was really tough. Let’s say you have 1000 of functions and you want to analyze which function consumes what memory. It’s practically just not possible to go through every call graph, do a find and get your functions.
The best way is to export a detail report in to excel and then analyze the data. So click on view à call tree.

Once you click on call tree you will be shown something as shown below. Click on view àAll functions à you will be shown all functions à click on file and save it as CSV.

Once you have exported the complete data to CSV, you can easily locate your methods and functions and see how much data has been allocated.

Simplifying results using comments
In case you know which methods to profile and you can enable the profiler at that moment when the method is called. In other words we can enable the CLR profiler from the application.
In order to enable the profiler from the C# code we need to first reference ‘CLRProfilerControl.dll’. You can get this DLL from the same folder where we have the profiler exe.
You can then directly call the profiler control from your code as shown in the below code snippet. We have enabled the profiler before we call both the string manipulation functions. Once the function calls are done we have disabled the profiler.
private void btnDoProfiling_Click(object sender, EventArgs e)
{
CLRProfilerControl.LogWriteLine("Entering loop");
CLRProfilerControl.AllocationLoggingActive = true;
CLRProfilerControl.CallLoggingActive = true;

UsingSimpleStrings();
UsingStringBuilders();

CLRProfilerControl.AllocationLoggingActive = false;
CLRProfilerControl.CallLoggingActive = false;
CLRProfilerControl.LogWriteLine("Exiting loop");
CLRProfilerControl.DumpHeap();
}
So now let’s run the CLR profiler and start our application. Please ensure that you disable the profile active check box because we are going to enable profiling from the code itself.

Now if you see the histogram you will see limited data. You can see it has only recorded memory allocation consumed from ‘System.String’ and ‘System.Text.StringBuilder’ data type.

If you see the allocation graph you can see it’s pretty neat now. The cluttered view has completely gone off and we have pretty simple and focused view. Please note to click ‘Everything’ to see the remaining functions.

As said before do not get carried away with execution time
On the summary page you can see the comments button. If you click on the comments button it shows start time and end time. Do not get carried away with the time recorded. As we have previously cleared that it’s an intrusive tool the results are not proper.

Entering loop (1.987 secs)
Exiting loop (2.022 secs)
Conclusion
• CLR profiler can be used to find memory allocated to functions, classes and assemblies to evaluate performance.
• It should not be used on production.
• It should not be used as a starting point for performance evaluation. We can first run perf counter, get the method having high execution time and then use CLR profiler to see the actual cause.
• You can use histogram to see memory allocation and call graph to see method wise memory allocation.
• If you know which methods you want to profile you can enable profiler from the application itself.
Concluding everything in to one basket as a best practice when you want to see memory allocation nothing can beat CLR profiler.
Source code
You can find the sample source code for profiling from here
Other Articles
For best Practices Part 2, click here
For best Practices Part 3, click here
For best Practices Part 4, click here
For best Practices Part 5, click here
My FAQ articles
I do understand that this is not the right article to talk about my FAQ’s. Just wanted to pat myself to complete 1 year of writing for my FAQ series. Below is the consolidated links for all:-
Silverlight FAQ :- http://www.codeproject.com/KB/WPF/WPFSilverLight.aspx
LINQ FAQ :- http://www.codeproject.com/KB/linq/LINQNewbie.aspx
WWF FAQ :- http://www.codeproject.com/KB/WF/WWF.aspx
WCF FAQ :- WCF.aspx
Sharepoint FAQ :- SharePoint.aspx
Ajax FAQ :- AjaxQuickFAQ.aspx
Architecture FAQ :- SoftArchInter1.aspx
Localization and globalization :- LocalizationGlobalizPart1.aspx
Project management FAQ :- ProjectManagementFAQ.aspx
For further reading do watch the below interview preparation videos and step by step video series.