
Genius Open HTML Generator - How To Easily Create an Amazing Report
Generate an HTML table in 4 lines of code either from a SQL query or a DataTable. Highlighting, sorting, all is customizable
Note: You can download the latest version on APIReport here.
Introduction
Imagine a world where you can generate in 4 lines of code a terrific HTML table from a MSSQL query (or a datatable), an HTML table with sorting, highlighting, with nice background color and one that is fully customizable.
This is APIReport. It is completely free and this is open!
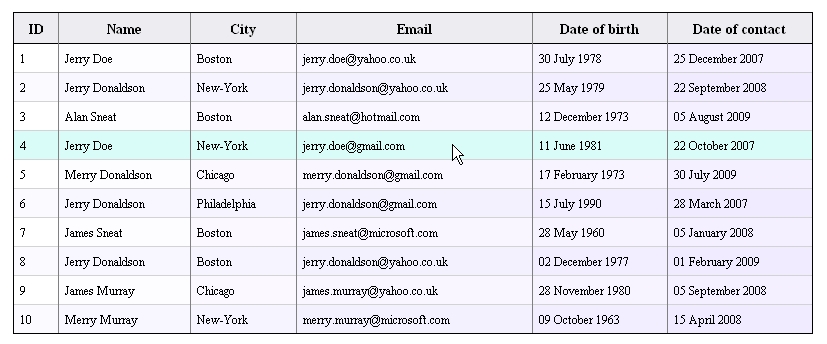
Here is the code to generate this table :
DocumentHTML myDoc = new DocumentHTML();
ReportSectionData myData = new ReportSectionData
	("select * FROM tblClient",connectionString));
myDoc.addSectionData(myData);
string myResultHTML =
	myDoc.getResult(true,true); //set active the sorting and highlighting
Note : ReportSectionData myData =
	new ReportSectionData(myDataTable); //would be just fine as well...
Background
This project started from a Swedish guy that came up with this question: How to generate an HTML table from my code extremely quickly and easily? Yet everything must be completely customizable.
I found his code on a dev forum and tried to contact him without success. That was 6 months ago, and this forum is not responding anymore. I decided to improve the concept and to add some nice features like a way for adding image, graph, text, sorting, highlighting, etc.
Finally as a lot of work has been done, a web site has been created that contains the library. So you can download the library on the APIReport.com site.APIReport is a play on words with Happy/API and report.
So that's the story... Now let's begin !
Using the Code
The concept is quite simple.
Firstly we define a DocumentHML. This is the main document where the different sections will be added.
DocumentHTML myDoc = new DocumentHTML();
Then we define the section that has to be added. There are 4 types of sections: data, text, image, graph.
ReportSectionData myData = new ReportSectionData
	("select * FROM tblClient",connectionString));
or
ReportSectionText myText = new ReportSectionText("This is my happy sample");
or
ReportSectionImage myImage = new ReportSectionImage("sampleImage.jpg") ;
or
ReportSectionGraph myGraph = new ReportSectionGraph
	(800,600,myTitle,"myGraph.png","SELECT * FROM tblSale");
Of course, each object can be customizable very deeply: color, type of graph, size, font, etc.
Then we add the sections to the document:
myDoc.add(myData);
myDoc.add(myText);
myDoc.add(myImage);
myDoc.add(myGraph);
Here you will have a document with 4 sections. You can have as many section as you want to.
Finally, we generate the HTML code:
 string myResultHTML =
	myDoc.getResult(true,true); //set active the sorting and highlighting
And that's all folks! So now that you have understood the concept, let's go to the features and the techniques used.
Data Section
When you construct a data section object, you can either give a DataTable or a Query of MSSQL (with the connection string).
By the way, you can also define how to invert the row and the column from the given data. This can be particularly handy when you give a small query and want to enlighten the data by inverting row and column.
The table of data will be really generated in HTML only at the last stage. So firstly you can define and customize everything you want. Every cell of a table has a font, a background color and a forecolor. To change it, you can directly use the related public attribute: example:
myData.BgColorCells[2][1] = Color.Red;
In the same way, you can define the alignment, the outer border (width and color), the inner border (width and color), display the title or not, the column size, the table size, the cell padding (you can distinguish the padding horizontal and vertical).
Every cell is generated in HTML with the same kind of format:
p <td align = "left" style="font-size:12px;border-top-color:#000000;
border-top: 1px solid #000000;border-bottom-color:#D3D3D3;
border-bottom: 1px solid #D3D3D3;border-left-color:#000000;
border-left: 1px solid #000000;border-right-color:#808080;
border-right: 1px solid #808080 " width="36" height="24" bgcolor="#FFFFFF">
<font color = "#000000">THIS IS MY TEXT </font></td>
As you can see, all the parameters must be generated for every cell. This code gives a similar result in Internet Explore 7.0, Firefox 3.5 and Chrome 2.0 (That's all the versions I have tested).
The counter side of defining all parameters is the longer of the generated code (that can be quite long, even for small tables).
Highlighting and Sorting
To end with the data section, I have to talk about the highlighting property and the sorting property. These two methods are working with a JavaScript code. They are applied for all the document HTML. So for example, if you have multi table in one document and want the sorting method working, then it will work for all of your tables.
The highlighting property has been written by F.Permadi and the sorting property comes from this site.
Both the codes have been compressed and obfuscated.
How Does It Work?
Highlighting: We add in the table tag the following code:
"onMouseOver="javascript:trackTableHighlight(event,'#DDDDDD')"
onMouseOut="javascript:highLightTableRow(0);"
And that's all. It works pretty well and we don't have to add this property in every row.
Sorting: We add in the table tag the following code:
"class = "sortable""
And that's all. If you use sorting, the outer and inner border should have the same color, and all the cells in the table should have the same color as well...
Painter

Well, painter is made for painting the table... For example, you want the background in red for all of your cells that are below zero.
As you have guessed, you can simply define every cell that is below zero by making this:
myData.BgColorCells[i][j] = Color.Red;
where [i][j] defines the cell below zero.
But there is a better way that is easier and cleaner:
Painter myPainter = new Painter("0",ActionZone.cell,ConditionType.small,-1,3,Color.Red);
myData.add(myPainter);
And the job is done. I let you have the joy to discover the meaning of each argument, but it's very easy.
All of the section data has been explained, this is initially why the project was developed. Now, text, graph and image section has been added later to have something complete and more interesting.
Text Section
It is very easy to use. You create a section with the text, you can define font, color and alignment... Not very much to say.
ReportSectionText myText = new ReportSectionText("This is my <i>funny</i> sample")
myText.Alignment = ContentAlignment.MiddleCenter;
myText.FontText = new Font("Times new roman",15.0F,FontStyle.Bold);
myText.ForeColor = Color.DarkRed;
In you text, you can have HTML code. This will be added directly when the document will be generated.
ReportSectionImage myReportSectionImage = new ReportSectionImage(@"C:\sampleImage.jpg");
myReportSectionImage.Position = Position.center;
Very easy is one subtlety: you can define a relative path where the image will be copied and used by the HTML document.
Graph Section
The graph section allows the generation and the insertion of a graph from data. This is quite magic. Well not really magic, but quite nice. So you define your section like that:
ReportSectionGraph myReportSectionGraph = new ReportSectionGraph
	(800, 600, "Benefice done by the company the last year", "Date",
	"Benefice in EURO", "imgSampleGraph.png", myDataTable);
The first column will always be the X-axes and every other column will be a new curve.
Note: If the first column is datetime-type, then it will be interpreted as-is, and scaled appropriately.
After that you can define the width of the curve, the type of the graph, the color of the graph.
Here is a sample for a datatable that has 4 columns:
myGraph.ArWidthLine = new float[] {3F,1F,1F};
myGraph.ArTypeGraph = new TypeGraph[]{TypeGraph.curve,TypeGraph.curve, TypeGraph.bar};
myGraph.ArColorGraph = new Color[]{Color.Red,Color.Green,Color.Tan};
And here is what we get with our example :
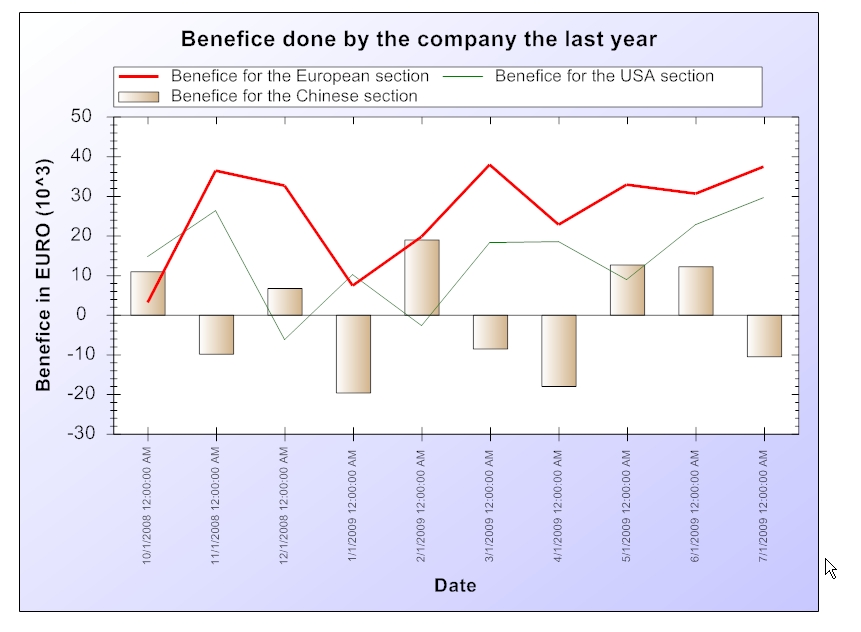
All of the columns (except the first one) must contain numbers. For example "3500 USD" will be interpreted as "3500". So a regex will take only the number : "(-)?\d+(.\d+)?"
The graph is generated thanks to zedgraph library.
Points of Interest
- Easy and short: This is the first idea. Make a report in 4 easy lines, don't bother with extra files, extra knowledge, etc.
- Fully customizable: Even if it can be short, you should and you can define precisely everything on the report.
- Painter: The concept of painting the report is quite nice.
- Multi-browser:
APIReportgenerates a code that has the same result on Internet Explorer, Firefox or Chrome (I didn't Safari, Opera or other one). - Open: Of course, this project has to be improved and is far from perfect. This is the reason why this project is opened to the community. Forum, questions, answers, last version is available here.
History
- 23rd October: First release
I hope you'll enjoy this project as much as I do.
Have a nice day !
Steven Darsin