
Examining Function Calls using the Console Debugger
4.13/5 (5 votes)
An article to teach troubleshooting by examining functions called by threads
Introduction
Examining Thread Call Stacks for Troubleshooting - The Stack and Understanding its Structure
The stack is an abstract data structure which keeps track of function calls recursively and grows from the higher addressed memory to the lower addressed memory. The fact that the stack grows allows the subject of buffer overflows to exist. A buffer is an array and refers to a storage place to receive and hold until it can be used by a process. Since each process may have its own set of buffers means that it is critical to keep them in place. Like a stack of dishes, each dish that you put (or push) onto the stack is taken off from the top of the stack (popped off). Both of these basic operations performed on a stack (push and pop) always work from the top, the memory algorithm is said to have last in first out (LIFO) semantics. In terms of code execution on a Windows operating system, the stack is a block of memory assigned by the operating system to a running thread. As stated, the function of the stack is to track the function call chain. For instance, when you see a box that requests user input for verification and validation, a function call was made to output that data box, wherein another function is made to grab the user input, wherein the another function is made to compare that user input with what the system expects, and so on. Tracking a function call therefore involves the allocation of local variables, parameters passing, and so on. Think of the algebraic function y = f(x). The values inserted into x determine the value of y, which determines the output of an operation. But any time a function call is made; another frame is created and is pushed on the stack. As the thread (that executes within a process) makes more function calls, the stack grows larger and larger. To give an example, examine this code that shows the starting point of a new thread that makes a series of nested function calls, as well as declaring local variables in each of the functions:
#include <windows.h>
#include <stdio.h>
#include <conio.h>

DWORD WINAPI ThreadProcedure(LPVOID lpParameter);
VOID ProcA();
VOID Sum(int* numArray, int iCount, int* sum);

void __cdecl wmain ()
{
    HANDLE hThread = NULL ;

    wprintf(L"Starting new thread...");

    hThread = CreateThread(NULL, 0, ThreadProcedure, NULL, 0, NULL);
    if(hThread!=NULL)
    {
        wprintf(L"Successfully created thread\n");
        WaitForSingleObject(hThread, INFINITE);
        CloseHandle(hThread);
    }
}

DWORD WINAPI ThreadProcedure(LPVOID lpParameter)
{
    ProcA();
    wprintf(L"Press any key to exit thread\n");
    _getch();
    return 0;
}

VOID ProcA()
{
    int iCount = 3;
    int iNums[] = {1,2,3};
    int iSum = 0;

    Sum(iNums, iCount, &iSum);
    wprintf(L"Sum is: %d\n", iSum);
}

VOID Sum(int* numArray, int iCount, int* sum)
{
    for(int i=0; i<icount;i++) *sum+=""numArray[i];""
To gain a better understanding of how the stack works and how it can become corrupted, we will use the cl.exe compiler that ships with Microsoft Visual Studio. When we compile this code, we use the /Zi switch to obtain extra debugging information and we will disable the /GS switch flag to avoid stack protection information: c:\...\VC\bin> cl.exe /Zi /GS- stackdesc.cpp. We now have an executable with debugging information, and object file, and an incremental linking file. We copy and paste these files to the “Debugging Tools for Windows” directory in order to use the console debugger, cdb.exe. When I wrote that stack operation gives rise to possible buffer overflows, consider this basic C program:
#include <stdio.h>
#include <string.h>
 int main (int argc, char *argv[])
  {
  char buffer[500];
  strcpy (buffer, argv[1]);
  return 0;
  }
This code allocates a buffer of a certain size, and then uses the string copy function to copy a string much into the allocated buffer (note that argv[0] is the name of the program file). Running this code results in a segmentation fault and it is suggested that you do not compile and run it.
Consider this image:
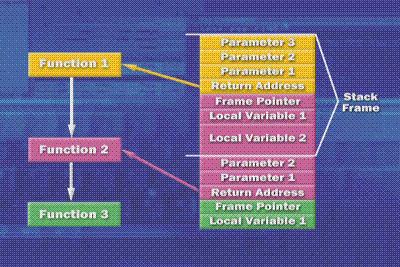
The referenced code above shows the main function creating a thread using the CreateThread API and the starting function of the thread to a function called ThreadProcedure. The ThreadProcedure() function is therefore the starting point of investigating this code with the cdb.exe debugger. When using the debugger, note that we have copied and pasted the debugging information into that directory. But good practice means setting the symbol path.
So we will start debugging, noting that the ‘x’ command requires the accurate debugging information in the symbols generated by the /Zi switch of the compiler. To begin, we start out with the cdb.exe debugger: C:\Program Files\Debugging Tools for Windows> cdb.exe StackDesc.exe:
c:\Program Files\Debugging Tools for Windows>cdb.exe StackDesc.exe

Microsoft (R) Windows Debugger Version 6.8.0004.0 X86
Copyright (c) Microsoft Corporation. All rights reserved.

CommandLine: StackDesc.exe
Symbol search path is: c:\symbols
Executable search path is:
ModLoad: 00400000 0042c000   StackDesc.exe
ModLoad: 77860000 77987000   ntdll.dll
ModLoad: 77320000 773fb000   C:\Windows\system32\kernel32.dll
(1720.120c): Break instruction exception - code 80000003 (first chance)
eax=00000000 ebx=00000000 ecx=0012fb08 edx=778b9a94 esi=fffffffe edi=778bb6f8
eip=778a7dfe esp=0012fb20 ebp=0012fb50 iopl=0         nv up ei pl zr na pe nc
cs=001b  ss=0023  ds=0023  es=0023  fs=003b  gs=0000             efl=00000246
ntdll!DbgBreakPoint:
778a7dfe cc              int     3
We notice that the Windows debugger automatically breaks in after initializing the process before execution begins. (You can disable this breakpoint by passing -g to cdb on the command line.) This is handy because at this initial breakpoint, your program has loaded, and you can set any breakpoints you’d like on your program before execution begins.
0:000> x stackdesc!*threadprocedure*
*** WARNING: Unable to verify checksum for StackDesc.exe
00401090 StackDesc!ThreadProcedure (void *)
0:000> bp stackdesc!threadprocedure
0:000> g
Starting new thread...Successfully created thread
Breakpoint 0 hit
eax=773648ff ebx=00000000 ecx=00000000 edx=00401005 esi=00000000 edi=00000000
eip=00401090 esp=008aff8c ebp=008aff94 iopl=0         nv up ei pl zr na pe nc
cs=001b  ss=0023  ds=0023  es=0023  fs=003b  gs=0000             efl=00000246
StackDesc!ThreadProcedure:
00401090 55              push    ebp
0:001> kb
ChildEBP RetAddr  Args to Child
008aff88 77364911 00000000 008affd4 7789e4b6 StackDesc ThreadProcedure!
008aff94 7789e4b6 00000000 77e175a8 00000000 kernel32!BaseThreadInitThunk+0xe
008affd4 7789e489 00401005 00000000 00000000 ntdll!__RtlUserThreadStart+0x23
008affec 00000000 00401005 00000000 00000000 ntdll!_RtlUserThreadStart+0x1b
The thread procedure is not the first function to execute. Rather, it is a function defined in kernel32.dll named BaseThreadInitThunk followed by a call to our first function. Now here is the tricky part. We have reached the starting point of our thread. We want to take a closer look at the stack to see how it is set up. The next instruction is to un-assemble the code, but we will see the typical program entry point 55 and the push ebp instruction. So what’s wrong with that? Well we are supposed to do a mov edi, edi instruction. This will be made clearer as we go on. Now recall that stack operations work recursively – that pop and push operations work from the top, while the stack is read from the bottom when we need to analyze a thread call stack.
0:001> u stackdesc!threadprocedure
StackDesc!ThreadProcedure:
00401090 55              push    ebp
00401091 8bec            mov     ebp,esp
00401093 e87cffffff      call    StackDesc!ProcA(00401014)
00401098 68c82c4200      push    offset StackDesc!’string’ (00422cc8)
0040109d e8ea000000      call    StackDesc!wprintf (0040118c)
004010a2 83c404          add     esp,4
004010a5 e886050000      call    StackDesc!_getch (00401630)
004010aa 33c0            xor     eax,eax
There is no mov edi, edi instruction above the push ebp function. Right about now, any reader must be wondering what that instruction has to with anything anyway. Deem it sufficient for now to know that the register ebp stores the base pointer for any given frame. So if it is saved onto stack, it is the frame pointer to the stack frame that existed prior to the creation of the new stack frame (that is, the call instruction). Since the base pointer (ebp) needs to be retained for each frame, it gets pushed onto the stack. The next instruction moves the stack pointer (not the base pointer) to the ebp register to establish the beginning of a new stack frame (because a function was called). Now we are at the point at which we are ready to call the ProcA procedure via the call function. The ‘uf’ instruction is to disassemble the entire ProcA function, which was called after the stack pointer started with 008aff8c to then be decremented by 4 (32 bits, 4 bytes, a DWORD). The resulting value for esp is 008AFF88. Note the value in the previous kernel stack dump:
008aff88 77364911 00000000 008affd4 7789e4b6 StackDesc ThreadProcedure!
This is why we are now in a position to disassemble the function ProcA:
0:001> uf stackdesc!ProcA
StackDesc!ProcA:
004010b0 55              push    ebp
004010b1 8bec            mov     ebp,esp
004010b3 83ec14          sub     esp,14h
004010b6 c745ec03000000  mov     dword ptr [ebp-14h],3
004010bd c745f401000000  mov     dword ptr [ebp-0Ch],1
004010c4 c745f802000000  mov     dword ptr [ebp-8],2
004010cb c745fc03000000  mov     dword ptr [ebp-4],3
004010d2 c745f000000000  mov     dword ptr [ebp-10h],0
004010d9 8d45f0          lea     eax,[ebp-10h]
004010dc 50              push    eax
004010dd 8b4dec          mov     ecx,dword ptr [ebp-14h]
004010e0 51              push    ecx
004010e1 8d55f4          lea     edx,[ebp-0Ch]
004010e4 52              push    edx
004010e5 e825ffffff      call    StackDesc!Sum (0040100f)
004010ea 83c40c          add     esp,0Ch
004010ed 8b45f0          mov     eax,dword ptr [ebp-10h]
004010f0 50              push    eax
004010f1 68042d4200      push    offset StackDesc!__xt_z+0x1c8 (00422d04)
004010f6 e891000000      call    StackDesc!wprintf (0040118c)
004010fb 83c408          add     esp,8
004010fe 8be5            mov     esp,ebp
00401100 5d              pop     ebp
00401101 c3              ret
The instruction sub esp, 0x14 (or decimal 20) means that there is a subtraction of 0x14 bytes from the stack pointer. Why? It is making room for local variables. Recall the source code for ProcA. It allocates the following local variables on the stack:
    int iCount = 3;
    int iNums[] = {1,2,3};
    int iSum = 0;
There are three ‘int’ variable declarations and assignments: one value for 4 bytes, 3 values for 12 bytes, and one value for 4 bytes, for a total of 20 bytes. So when we subtract 20 bytes from the stack pointer, the gap in the stack becomes reserved for the local variables declared in the function. After the stack pointer has been adjusted to make room for the local variables, the next set of instructions executed initializes the stack-based local variables to the values specified in the source code:
004010b6 c745ec03000000  mov     dword ptr [ebp-14h],3
004010bd c745f401000000  mov     dword ptr [ebp-0Ch],1
004010c4 c745f802000000  mov     dword ptr [ebp-8],2
004010cb c745fc03000000  mov     dword ptr [ebp-4],3
004010d2 c745f000000000  mov     dword ptr [ebp-10h],0
After the local variable initialization (where the data types are assigned values), we have a series of instructions that gets the application to make another function call:
004010d9 8d45f0          lea     eax,[ebp-10h]
004010dc 50              push    eax
004010dd 8b4dec          mov     ecx,dword ptr [ebp-14h]
004010e0 51              push    ecx
004010e1 8d55f4          lea     edx,[ebp-0Ch]
004010e4 52              push    edx
004010e5 e825ffffff      call    StackDesc!Sum (0040100f)
Three Parameters are Passed to the Function
- A pointer to an integer array, which contains the numbers to be added.
- An integer that represents the number of integers in the array.
- A pointer to an integer that will (upon success) contain the sum of all the integers in that array.
Whenever a call instruction results in calling a function with parameters, the calling function is responsible for pushing the parameters onto the stack from right to left. This is how the above list (parameters) is passed from the ThreadProc function to the Sum function. Now notice the call to the printf function and the string.
0:001> du  00422d04
00422d04  "Sum is: %d."
The ‘du’ instruction is meant to dump Unicode text, as evidenced by the “L” that precedes the statements in the source code. Many, if not every function prologues, begin with a mov edi, edi instruction. While it is simply a NOP instruction, the Advanced Debugging for Windows teaches that it could be used to enable hot patching. Hot patching refers to the capability to patch running code without the frustration of first stopping the component being patched. It is important because it avoids downtime in system availability. The concept behind this mechanism is that the 2 byte mov edi, edi instruction can be replaced by a “jmp” instruction that can execute whatever new code is desired. Opcode contains 7 jump instructions, 6 of which are conditional and one of which takes control by jumping straight to a landing address. Examine the following instruction and recall that the first function was contained in kernel32.dll:
0:001> u kernel32!FindFirstFileExW
kernel32!FindFirstFileExW:
77360a33 8bff            mov     edi,edi
77360a35 55              push    ebp
77360a36 8bec            mov     ebp,esp
77360a38 81eccc020000    sub     esp,2CCh
77360a3e a1acd43e77      mov     eax,dword ptr [kernel32!__security_cookie (773e
d4ac)]
77360a43 33c5            xor     eax,ebp
77360a45 8945fc          mov     dword ptr [ebp-4],eax
77360a48 837d0c01        cmp     dword ptr [ebp+0Ch],1
References
- Advanced Windows Debugging by Mario Hewardt and Daniel Pravat
- Windows Internals by Mark Russinovich and David Solomon
- Windows System Programming by Johnson M. Hart
History
- 10th March, 2009: Initial post