
Cross-platform C++ Template Solution for Drawing GPS Data for a Third-party GIS
4.11/5 (5 votes)
Generates PNG files called tiles which form a layer on a GIS map
Introduction
Suppose you are a GIS novice roughly thrown by your manager to implement a project which is supposed to work for some third-party GIS. The technical assignment is quite abstract leaving you with a slight feeling of nausea creeping up your throat because you're not familiar with the terms used in it.
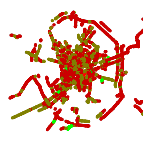
Your TA says that you are given an XML data with GPS coordinates of your city jams. You are to create something to generate PNG files. Those files are called tiles each of 256x256 pixels. The files are generated to directories. Each directory is named after the zoom coefficient from 8 to 17. The idea behind this is to map a GPS coordinates (latitude and longitude) to the Cartesian plain (X/Y), calculate the size of the pixel in meters according to the zoom coefficient and draw the polyline through one or more PNG files (tiles). The result which must be in the end is shown on pic. 1 and pic. 2.
Pic. 1
Mercator Projection Short and Sweet
The GPS uses Geographic Coordinate System. In short, the latitude is an angle from a particular point to the equator line, and the longitude is an angle to pole-to-pole line. We have to project (transform) these angles to the Cartesian plain (X/Y). But projecting from angles which represent a point on the spherical surface means distortion. The mankind tried to diminish this distortion for many a year through adopting various projections of the Globe onto the plain surface. The revolution came with appearance of the Mercator projection. From that time on sailors could use a compass and a map to plot their voyages.
This template project uses the sinusoidal aka elliptical Mercator projection according to which the Earth is not a sphere but an oblate spheroid flattened at the poles. One may imagine this projection as the interior of the spheroid whilst the original Mercator projection as the interior of the cylinder sacrificing the poles.
WGS84 Datum
When we talk about using a projection we talk about formulae. And almost any formulae need constants. As far as the map projections go, those constants are specified in the standard called datum. Most formulae nowadays use WGS84. According to this datum, the Earth is a spheroid with the major radius aka major semi-axis of 6,378,137 m in length.
Using the major radius, we can find the pixel size depending on the zoom coefficient. And that’s accomplished through this brilliant formula (refer to mathematicians for further comments) 2pr/n*2z where r is the major radius, n is a number of pixels in PNG file and z is a zoom coefficient.
Tilerizing
At rush hour the city is covered with jams, so the jams form its rough map. The whole city almost fits one tile at the smallest zoom (zoom 8 on pic. 1 above). We soar high above in the sky at the altitude of an air liner or even higher. One pixel is approximately 611 m. At the largest zoom (zoom 17) we descent much closer and hover a few meters off the ground. One pixel is almost one meter. While the entire city fits one tile at zoom 8 it is split between thousands of tiles at zoom 17. The result may be imagined as a grid as seen in pic. 2.
I spent too much time on finding intercepting points on the tile borders. Either due to graphic engine peculiarities or calculation inaccuracies a line in one tile would not fit slightly its continuation in another. Then I found out that the graphic engine is capable of clipping. That meant I had no longer to calculate intercepting points (I like calling them bordering points). The graphic library would do that for me. All I had to do was to calculate pixel coordinates of a particular point as seen from a particular tile. I had no longer to worry about the fact if the point is inside or outside the tile and create an intercepting point if it’s outside.
 |
 |
 |
|
Pic. 2
Compilation and Execution
The project presented here is a Visual Studio 2008 solution. It uses the GNU libraries as shown in table 1 for XML parsing and drawing as shown in table 1. Non-Windows users are welcome to create a makefile and send it to me. :) If run in debug mode, files are generated to Files directory inside the solution folder. Next to the PNG files you'll find JSON (bearing .js extension) files. By means of those a third-party GIS may show the pop-up when mouse hovers along a particular jam polyline. You can reformat them according to your GIS requirement or turn them off by defining _NOT_GENERATE_JSON macro in stdafx.h. An input XML file jams.xml is inside the solution directory. It is used in debug mode by default. You can see the result of processing this file on the pictures above.
| Library Name | Purpose |
| LibXml2 | XML parser |
| Cairo | Graphic engine |
| LibPng | Used by Cairo for PNG creation |
| Iconv | Used for various encoding transformations |
| Zlib1 | Used by all above |
For Windows users only, in order to compile the solution, download gnu_libs.zip and copy its contents to C:\Program Files.
NB! To run in debug mode, copy all DLLs found in GPRender_exec.zip to ..\GPRender\GPRender\Debug directory next to the executable.
Using the Code
Pic. 3 shows the UML of the basic classes used in the project. Different sorts of GIS use different projecting algorithms. For one I'm not sure if the project is compatible with Google Maps. The only thing I'm aware of is that the formulae used in it were once compatible with OpenStreetMap.
You are free to experiment by introducing other algorithms by specifying your class in the template parameter of GZoomT class. GZoom class found in GZoom.h is a typedef:
typedef GZoomT<> GZoom;
GZoomT uses GMCalculus from GMercator.h as its default template parameter.
template<class T=GMCalculus>
class GZoomT;
The same goes for GPoint class in GShapes.h. Below is the UML diagram of the basic classes of the project:
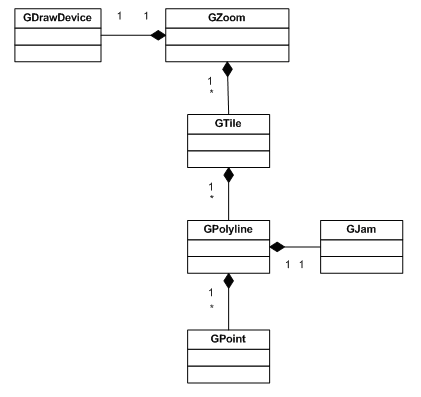
Pic. 3
Interesting Code Extracts
Actual processing is done in GZoom::Tilerize():
void inline Tilerize()
{
//tilerizes the jams
groupedbystreet::const_iterator it = mJams.begin();
for ( ; it != mJams.end(); ++it )
{
FillTilesInFirstJam(it->second);
++it;
break;
}
for ( ; it != mJams.end(); ++it )
FillTilesInJam(it->second);
//creates missing tiles and adds points relative to
//current tile or next tile
createMissingTiles();
//merges the tiles with the same name
MergeTheProcessed();
//generates files
for ( set
GZoom::FillTilesInJam() iterates through the jams creating tiles for the point list of each jam member. At this step, each GTile has one GPolyline member. We don't care about duplication of tile names.
void inline SplitToTilesWithDups(const GJam& jam, const GPoint& p)
{
	GTile& tile = mTiles.back(); //current tile

	if ( tile.Contains(p) && tile.GetJamID() == jam.mIDJam )
		tile.AddPointCalcPixel(p);
	else //ANOTHER TILE - one tile one polyline at this step!!!
		mTiles.push_back( CreateNewTile(jam, p) );

	CreateArrow(mTiles.back(),jam,p);
}
Now generate missing tiles if any. GZoom::ProcessPair() fills in the gaps between two neighboring tiles belonging to the same jam.
void inline createMissingTiles()
{
//more code here
	if ( currTile.GetJamID() == nextTile.GetJamID() )
	{
		assert ( 1 == currTile.Polylines().size()
&& 1 == nextTile.Polylines().size() );
		ProcessPair(currTile, nextTile);
	}

	mProcessedTiles.push_back(currTile);
	mProcessedTiles.push_back(nextTile);
	currTile = *it;
//more code here
}
At this step, there are lots of duplicate tiles. That is the tiles with the same name but from different jam. So we merge them by pushing the duplicate's GPolyline element into the GTile with the same name and eliminating the duplicate. This is achieved with std::set.
void inline MergeTheProcessed()
{
	for ( tilelist::iterator it = mProcessedTiles.begin();
it != mProcessedTiles.end(); ++it )
	{
		pair<set><gtile>::iterator, bool> p = mMergedTiles.insert(*it);
		if ( ! p.second )
		{
			GTile& prevTile = *(p.first);
			GTile& nextTile = *it;
	const_cast<polylist&> ( prevTile.Polylines() ).push_back
		( nextTile.Polylines().back() );
		}
	}
}
And last but not the least, draw the tiles from the set container which is done by gDevice.DrawPolies() in GZoom::Tilerize().
History
- 21st December, 2008: Initial post