
WPF Deobfuscator Addin to Visual Studio
4.75/5 (4 votes)
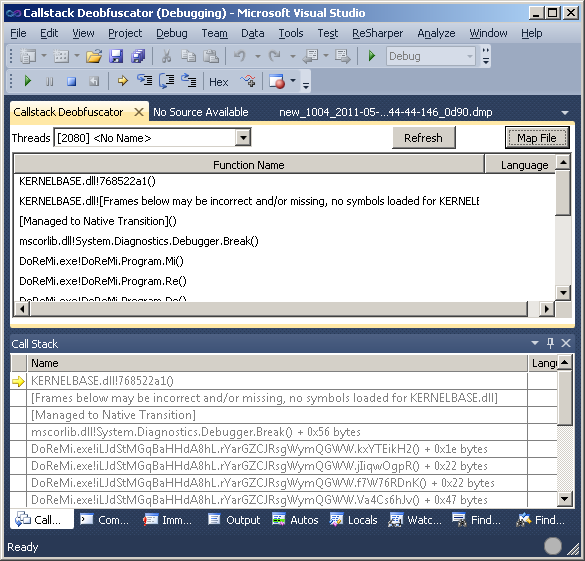
A WPF control that deobfuscates the callstack on the fly
Introduction
This article shows how to create a Visual Studio 2010 Addin, showing a deobfuscated callstack in a WPF control. The window will keep itself updated along with the standard callstack window.
Background
I was once assigned the task to evaluate the applicability of code obfuscation of .NET assemblies with respect to protection of intellectual property, but also its consequences for debugging and support. Obfuscation is not without drawbacks. It makes debugging almost impossible, unless it is possible to reverse the obfuscation. If you debug an obfuscated assembly, you will not see readable method names, but cryptic names. The Obfuscator I evaluated provided an external tool for deobfuscation with the use of map files. You had to manually copy and paste the text into the tool.
Manually doing this is quite cumbersome, so some time ago, I wrote a Windbg extension for showing the deobfuscated callstack directly, .NET Windbg Extension Development in Visual Studio. That was good enough for me, but a colleague which doesn't like Windbg requested a Visual Studio Addin from me.
This is my first attempt to create a Visual Studio Addin. The aim of this plugin is to deobfuscate these cryptic names into readable ones by the use of a map file. Whenever the callstack is updated, the deobfuscated callstack will also update itself automatically.
Creating an Addin
The Wizard for creating a Visual Studio Addin actually takes you quite far.


A file will be created named Connect.cs that implements the interface IDTExtensibility.
public class Connect : IDTExtensibility2
{
  public Connect()
  {
  }

  public void OnConnection(object application,
	ext_ConnectMode connectMode, object addInInst, ref Array custom)
  {
    _applicationObject = (DTE2)application;
    _addInInstance = (AddIn)addInInst;
  }

  public void OnDisconnection(ext_DisconnectMode disconnectMode, ref Array custom)
  {
  }

  public void OnAddInsUpdate(ref Array custom)
  {
  }

  public void OnStartupComplete(ref Array custom)
  {
  }

  public void OnBeginShutdown(ref Array custom)
  {
  }

  private DTE2 _applicationObject;
  private AddIn _addInInstance;
}
For interacting with Visual Studio, there is an object, _application, which can be used to traverse debugged processes, threads, callstacks, etc. It also contains events which you can register your own handlers to. I use one of those in order to update the callstack.
The first thing you usually do is adding at least one command in the tools menu, so that you can interact with the Addin. This GUI code should be placed in the OnConnection method. If you selected yes to the option "Would you like to create command bar UI for your Add-in?", the wizard will already have generated code for that.
Interacting with Visual Studio
The second step is to implement the interface IDTCommandTarget.
public class Connect : IDTExtensibility2, IDTCommandTarget
You should implement both QueryStatus and Exec.
QueryStatus I think is about telling the GUI about the availability of the command. For example, you might want to make it unavailable in certain situations or contexts.
public void QueryStatus(string commandName, vsCommandStatusTextWanted neededText,
	ref vsCommandStatus status, ref object commandText)
{
   if (neededText == vsCommandStatusTextWanted.vsCommandStatusTextWantedNone)
   {
      if (commandName == "Deobfuscator.Connect.Deobfuscator")
      {
         status = (vsCommandStatus)vsCommandStatus.vsCommandStatusSupported |
         vsCommandStatus.vsCommandStatusEnabled;
         return;
      }
   }
}
Exec is the callback where we should put the command code.
public void Exec(string commandName, vsCommandExecOption executeOption,
	ref object varIn, ref object varOut, ref bool handled)
{
   handled = false;
   if (executeOption == vsCommandExecOption.vsCommandExecOptionDoDefault)
   {
      if (commandName == "Deobfuscator.Connect.Deobfuscator")
      {
         handled = true;
         // We will insert code here
      }
   }
}
Before I show you the code, let me first explain the first attempt and the problems I ran into.
First Attempt - Intercepting Commands
I don't know if there is an easy way to filter the normal callstack window and display a deobfuscated callstack. I settled for a simple solution which displayed the deobfuscated callstack in a new separate window.
In my first attempt, I tried to intercept calls to Step Into, and Step Over commands. In the _applicationObject.Events.DebuggerEvents, you can register BeforeExecute and AfterExecute events for all of the debug commands. So a straightforward approach was to register an event handler for the AfterExecute event for these commands. Unfortunately, it didn't work. When I got the AfterExecute event, the callstack wasn't always available. Many of the sub objects in the _application object were null. Strangely enough, it was sometimes available, and sometimes not. Mostly not. When I was debugging it, the sub objects were almost always available.
var dte2 = _application;
if (dte2.Debugger.DebuggedProcesses == null)
	return null;
I didn't understand why the objects were null if I indeed was debugging a program. I made a work-around. After the AfterExecute event. I told a background worker thread to update the callstack when the object became available again. Effective, but a very very ugly solution. A coder with an ounce of self respect wouldn't settle for a solution like that.
The Second Attempt - OnEnterBreakMode
Searching for a better solution, I finally came up with a much better solution. There is a callback called OnEnterBreakMode that I should have used from the beginning.
_debugEvents = _applicationObject.Events.DebuggerEvents;
_debugEvents.OnEnterBreakMode += DebugEvents_OnEnterBreakMode;
Then, regardless of the command. For whatever reason the debugger breaks, hitting a breakpoint or finishing a step over/into command, the event will be triggered. The best of all, the callstack is always available when this event arrives. In this callback, I simply tell the Window to refresh its call stack.
void DebugEvents_OnEnterBreakMode(dbgEventReason Reason,
	ref dbgExecutionAction ExecutionAction)
{
   _wpfToolWindow.RefreshCallStack();
}
Deobfuscating the Callstack
Writing out the Callstack is straightforward. _application.Debugger.CurrentThread points to the current active thread in the callstack window. Then, it is just a question of looping over the stack frames.
var thread = _application.Debugger.CurrentThread;
foreach (EnvDTE.StackFrame sf in thread.StackFrames)
{
   var sb = new StringBuilder();
   var filename = System.IO.Path.GetFileName(sf.Module);
   sb.Append(filename);
   sb.Append('!');
   sb.Append(sf.FunctionName);
   sb.Append('(');
   // Optionally loop over the arguments
   sb.Append(')');
   // Deobfuscate sb.ToString()
   // and add the result to the Callstack ListBox
}
Finishing Up
In total, I used 3 events:
OnEnterBreakMode- To update the callstackOnEnterRunMode- To update a combobox that displays the active threadsOnContextChanged- To always display the same thread as in the standard callstack window
_debugEvents = _applicationObject.Events.DebuggerEvents;
_debugEvents.OnEnterBreakMode += DebugEvents_OnEnterBreakMode;
_debugEvents.OnEnterRunMode += DebugEvents_OnEnterRunMode;
_debugEvents.OnContextChanged += DebugEvents_OnContextChanged;
In the Exec method, I create the WPF window, and pass a reference to the _application object to the WPF control. I also register the event callbacks. When the callbacks are executed, they call into the WPF control and tell it to update itself. By using the _application object, the WPF control can loop over the current debugged thread and extract the stack frames.
Deployment
A manual install can be done by just copying the files to C:\Users\[your user login]\Documents\Visual Studio 2010\Addins.
I chose to make a small installer. The preferred way is to make a nice installer with wsix or msi, but I took a shortcut here and used the Visual Studio Content Installer. With the Visual Content Installer, you just need to create a .vscontent file.
<VSContent xmlns="http://schemas.microsoft.com/developer/vscontent/2005">
  <Content>
    <FileName>Deobfuscator.Addin</FileName>
    <FileName>Deobfuscator.dll</FileName>
    <FileName>StackTraceDeobfuscator.dll</FileName>
    <DisplayName>.Net Reactor Deobfuscator</DisplayName>
    <Description>Deobfuscates callstack on the fly</Description>
    <FileContentType>Addin</FileContentType>
    <ContentVersion>2.0</ContentVersion>
  </Content>
</VSContent>
The next step is to put all the necessary files in a zip archive which you give the extension .vsi.

To install it, you just double click on the file.

You might need to manually activate the plugin. In the Tools menu in Visual Studio, open the Addin Manager, and activate it.

Using the Addin
This particular Addin just converts the callstack to uppercase letters, since I didn't want to redistribute the commercial DLL.
In my evaluation, I actually used .NET reactor. If you are interested in using their deobfuscator binary instead of my dummy library, simply replace StackTraceDeobfuscator.dll with their version, which you will find in the installation directory under the folder SDK, then update the namespace qualifier to eziriz, instead of StackTraceDeobfuscator and rebuild. If you use other obfuscator libraries, this code should be easy to adapt.
After loading your program, execute the command "Deobfuscator". This will create the deobfuscator callstack window. Dock it, where you want it to be. The next step is to read the map file. After that, the window should automatically be updated along with the standard callstack window.
If you start the Addin before you start your debugging, the window might hide itself, in that case, start it again and it will become visible.
Todo
Running the commands Step-over and Step into automatically puts focus on the normal callstack window. It would be nice if focus could stay on the deobfuscated window.
I cut some corners. The callback OnConnection is implemented, but not the OnDisconnection. This is my first Addin for Visual Studio. Any comments and suggestions that can help are welcome. This Addin only works in Visual Studio 2010, unfortunately I didn't find any way to stop the installer to add it to Visual Studio 2008. So if you have both 2008 and 2010 installed, it will be installed twice.
Points of Interest
I wrote a Windbg extension some time ago, .NET Windbg Extension Development in Visual Studio. which also implements a deobfuscator.
Visual Studio 2010 has introduced a WPF based GUI, which simplifies use of WPF controls directly in the GUI, but it still needs a few tweaks, Create a WPF based ToolWindow in your Add-In.
History
- 2nd June, 2011: Initial post