
Credit Risk Classification: Faster Machine Learning with Intel Optimized Packages
This paper explains the importance of using Intel® Performance Libraries to solve a machine-learning problem such as credit risk classification.
Abstract
This paper explains the importance of using Intel® Performance Libraries to solve a machine-learning problem such as credit risk classification. The objective of solving a credit risk classification problem is to minimize loss from the bank’s perspective; for example, when a person applies for a loan, the bank has to make a decision regarding whom to give approval for the loan and whom not to. The case study uses Intel® Distribution for Python* and Python API for Intel® Data Analytics Acceleration Library (Intel® DAAL)—named PyDAAL—to boost machine-learning and data analytics performance. Using the advantage of optimized scikit-learn* (Scikit-learn with Intel DAAL) that comes with Intel® Distribution for Python, we were able to achieve good results for the prediction problem.
Introduction
Credit risk is one of the major financial risks that exists in the banking system. How a bank manages its credit risk is very critical for its performance over time; capital depletion through loan losses has been the proximate reason for most organization failures. Distinguishing and rating credit risk is the primary step in managing it effectively. The applicant is a good credit risk if the user is likely to repay the loan. Conversely, if the user is not likely to repay the loan, the applicant is considered as a bad credit risk. The bank has to analyze applicant’s demographic and socio-economic profiles before a decision is made regarding his and her loan application.
With the help of Intel optimized computational packages and an Intel® Xeon® Gold 6128 processor, a faster predictive model is developed on this data. The machine-learning model helps to guide the bank manager to make a decision whether to approve a loan to a prospective applicant based on his and her profiles.
Hardware Details
The hardware configuration of Intel® Xeon® Gold 6128 processor is shown in table 1.
Table 1. Hardware Configuration.
| Name | Description |
| Intel® Xeon® Gold processor based architecture | x86_64 |
| CPU op-mode(s) | 32-bit, 64-bit |
| Byte order | Little Endian |
| CPU(s) | 24 |
| On-line CPU(s) list | 0-23 |
| Thread(s) per core | 2 |
| Core(s) per socket | 6 |
| Socket(s) | 2 |
| NUMA node(s) | 2 |
| Vendor ID | Genuine Intel |
| CPU family | 6 |
| Model | 85 |
| Model name | Intel® Xeon® Gold 6128 processor 3.40 GHz |
| Stepping | 4 |
| CPU MHz | 1199.960 |
| BogoMIPS | 6800.00 |
| Virtualization type | VT-x |
| L1d cache | 32K |
| L1i cache | 32K |
| L2 cache | 1024K |
| L3 cache | 19712K |
| NUMA node0 CPU(s) | 0-5,12-17 |
| NUMA node1 CPU(s) | 6-11,18-23 |
Software Configuration
The development of this use case had the following dependencies (table 2).
Table 2. Software Configuration.
| Library | Version |
| Anaconda* with Intel channel | 4.3.21 |
| Intel® optimized for Python* | 3.6.3 |
| Optimized scikit-learn* | 0.19.0 |
| Intel® optimized for NumPy | 1.13.3 |
Dataset Description
The original dataset contains 1,000 entries with 20 categorical and symbolic attributes. Each entry represents a person who applies for a credit loan with a bank. Each person is classified as good or bad credit risks according to the set of attributes. Table 3 shows the set of attributes in the dataset.
Table 3. Dataset Description.
| Attribute Name | Attribute Description |
checking_status | Status of existing checking account, in Deutsche Marks (DM) |
duration | Duration in months |
credit_history | Credit history (credits taken, paid back duly, delays, critical accounts) |
purpose | Purpose of the credit (car, television, etc.) |
credit_amount | Credit loan amount, in Deutsche Marks (DM) |
savings_status | Status of savings account and bonds, in Deutsche Marks |
employment | Present employment, in number of years |
installment_commitment | Installment rate in percentage of disposable income |
personal_status | Personal status (married, single, etc.) and sex |
other_parties | Other debtors and guarantors |
residence_since | Present residence since X years |
property_magnitude | Property (e.g., real estate) |
age | Age in years |
other_payment_plans | Other installment plans (banks, stores, etc.) |
housing | Housing (rent, own) |
existing_credits | Number of existing credits at this bank |
job | Job |
num_dependents | Number of people being liable to provide maintenance for |
own_telephone | Telephone (yes and no) |
foreign_worker | Foreign worker (yes and no) |
class | Good credit or bad credit |
Intel® Distribution for Python*, Optimized scikit-learn*, and PyDAAL module
Machine learning and data analysis using Python get their power with Intel® Distribution for Python1. Intel® Distribution for Python is equipped with Intel optimized computational packages2 like NumPy, SciPY, scikit-learn* and PyDAAL (a free package which implements Python bindings to the Intel® Data Analytics Acceleration Library, or Intel® DAAL)3.
scikit-learn is a commonly used library for machine learning mainly because of its algorithm richness. Intel DAAL is more than just a set of machine-learning algorithms, as it implements and optimizes the full data analysis pipeline, from loading data and transforming and filtering it to analysis and modeling of data with classic statistical and machine-learning techniques, as well as advanced deep-learning methods. scikit-learn algorithms shipped within Intel® Distribution for Python take advantage of PyDAAL, bringing scikit-learn performance to new levels.
Solution Design
The major steps involved in solution design are shown in Figure 1.

Detailed explanation of each step is given below.
Dataset Analysis
The primarily part in any predictive modelling task is the dataset analysis, which is nothing but an initial exploration of data. The goal of dataset analysis is to have a solid understanding of data, to derive a better solution. Gathering good information about data also helps with feature engineering and feature selection. Data visualization using graphs helps us understand the relation between attributes and patterns in the data.
The German credit dataset4 has 21 features out of which 14 are categorical variables and the remaining 7 are numerical. The last column is the label, which denotes the credit risk and has only two possible values: good credit risk and bad credit risk. Since both categorical and numerical variables are included in the data set, appropriate statistical and distribution analysis are provided.
Numerical Variable Analysis
Table 4 shows the summary of all the numerical variables in the dataset. It includes count, mean, standard deviation (std), min, quartiles, and max in its output.
Table 4. Numerical Variable Analysis.

![]()
Here are few inferences that were obtained:
- There are no missing values in the dataset. Count is 1,000 for all columns which means that all the values are present for each attribute in 1000 rows of the dataset
- Most of the credit loan amount requests are in the range of 3,000DM-4,000DM.
- The mean average duration is about 21 months and age is around 36 years.
Categorical Variable Analysis


Most of the credit loan amounts are in the range of 2,000DM-4,000DM (Figure 2). The largest amount given is as high as 18,000DM. Box plot analysis shows that higher credit loan amounts are mostly bad credit risks (Figure 3).

Television and radio or a new car are the top reasons for most applicants seeking a credit. loan. Very few applicants are seeking a credit loan for education or retraining. This may mean that either education and retraining are not worth a credit loan or that their costs have been covered entirely either by the schools, universities, government, or in some other way, which seems very unlikely.

Plotting the frequency of the credit loan against the age groups in Figure 5 shows that credit demands from applicants between the ages of 20 and 39 make up for about two-thirds of the total credit demands.
Data Pre-processing
Data pre-processing involves the transformations being applied to the data before feeding it to the algorithm. Since most of the variables in the dataset are categorical, various techniques need to be applied for converting the categorical to numerical variables.
- Converting binary categorical data to numerical: In this step, the yes or no columns
own_telephone,foreign_worker(Refer Table 3) are converted to 1s and 0s. - One-hot encoding: This technique transforms each categorical feature with n possible values into n binary features, with only one active. The Pandas package in Python supports this feature using the
get_dummiesmethod. This function is named this way because it creates dummy and indicator columns. The following columns in the German credit data are one-hot encoded:checking_status, credit_history, savings_status, employment, personal_status, other_parties, job, housing, other_payment_plans, property_magnitude - Label encoding: Another approach for converting categorical variables to numerical is by using label encoding, which converts each value in a column to a numeric value. The
purposecolumn in the data is label-encoded. The optimized scikit-learn* has a pre-built functionality for preprocessing using the scikit-learn pre-processing module.
Feature Selection
Datasets may contain irrelevant or redundant features that might make the machine-learning model more complicated. In this step, we aim to remove the irrelevant features which may cause an increase in run time, generate complex patterns, etc. The generated subset of features is used for further analysis. The feature selection can be done either by using Random Forest or Xgboost algorithm. In this experiment, the Xgboost algorithm is used to select the best features which has a score above a predefined threshold value . Table 5 shows some of the features sorted based on the score value.
Table 5. Feature Importance
| Feature | Score |
credit_amount | 0.1724 |
duration | 0.1122 |
age | 0.1057 |
purpose | 0.0634 |
checking_status_no checking | 0.0423 |
installment_commitment | 0.0341 |
plan_none | 0.0309 |
employment_4<=X<7 | 0.0293 |
residence_since | 0.0260 |
credit_history_all paid | 0.0244 |
Data Split
Splitting the train and test data: The data is then split into train and test sets for further analysis. 90% of the data is used for training and 10% is for testing. The train_test_split function in scikit-learn is used for data splitting.
Classifier Implementation
Classifier is implemented using two packages: scikit-learn with Intel DAAL and PyDAAL.
scikit-learn with Intel DAAL
Balancing the dataset
The dataset is highly imbalanced with 70% of the data containing good credit risks. This data imbalance is handled by the SMOTE algorithm, which generates the new smoted dataset that addresses the unbalanced class problem. It artificially generates observations of minority classes using the nearest neighbors of this class of elements to balance the training dataset.
Model Building and Training
There are various machine-learning models (algorithms) that are created by researchers and data scientists over years. In this stage, machine-learning models are selected for training. All classifiers in scikit-learn use a fit (X, y) method to fit the model for the given train data X and train label y. To compare the performance of various models, an ensemble of classifiers is used. Once the model is trained, it can be used for prediction.
Prediction
During this stage, the trained model predicts the output for a given input based on its learning. That is, given an unlabeled observation X, predict (X) returns the predicted label y.
Evaluation
In order to measure the performance of model, various performance evaluation metrics are available. We have used accuracy, precision, and recall as our evaluation metrics to choose the best model for the problem.
Python API for Intel DAAL-PyDAAL
Data Representation in PyDAAL
All the pre-processing steps upto Step 4 (data split) are the same for PyDAAL implementation. Every algorithm in DAAL accepts inputs in the form of NumericTables, a generic data type for representing data in memory. Since all the converted features are of the same type, we have used HomogenNumericTables for representation. The dataset obtained after feature selection in scikit-learn, is in the form of NumPy ndarray. This can be easily converted to a HomogenNumericTable using the built-in function in the DAAL data management module5.
Model Building and Training
An algorithm object is created to train the classifier in appropriate processing mode (Batch and Online and Distributed)5.The two pieces of input (i.e., data and labels) are set using the input.set member methods6 of the algorithm object. Further, the compute() method is used to update the partial model.
Prediction
After creating the model, a prediction object is defined. The testing data set and the trained model are passed to the algorithm using the input.setTable() and input.setModel() methods, respectively. The predictions are computed using the compute() method.
Evaluation
After finding the predictions using the compute() method, the accuracy, precision, recall, and f1-score of the model are calculated.
Experimental Results
Since the problem is binary classification, apart from the accuracy, the evaluation metrics such as precision, recall, and F1 score are used to identify the best classifier from the ensemble of algorithms. The classifiers are categorized as Best, Good, and Poor based on the performance evaluation metrics. The classifier that gives a stable value for Accuracy, Precision, Recall, and F1 score is categorized as the best classifier, whereas the classifier that gives highly varying values for the evaluation metrics is categorized as a poor classifier.
Using scikit-learn with Intel DAAL
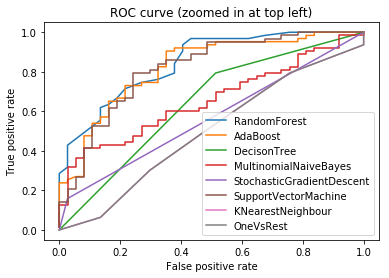
Table 6 depicts the results of using various classifiers on the balanced and unbalanced datasets. Comparison of results for full and feature selected datasets are also given. All the features are pre-processed using encoding techniques discussed under the data pre-processing section. Receiver Operating Characteristic curve (or ROC curve) is also plotted for each classifier to analyze the classifier performance. The closer the curve follows the left-hand border and then the top border of the ROC space, is considered as the best classifier. Figure 6 shows the ROC curve for classifiers in scikit-learn with Intel® DAAL. ROC curve demonstrates that Random Forest Classifier and Ada Boost classifier are the best classifiers.
Table 6. Experiment Results of scikit-learn* with Intel® DAAL.
| Classifiers | Unbalanced full training data (%) | Unbalanced feature selected data (%) | Balanced feature selected data (%) | |||||||||
| Acc. | Precision | Recall | F1-score | Acc. | Precision | Recall | F1-score | Acc. | Precision | Recall | F1-score | |
| Best | ||||||||||||
|---|---|---|---|---|---|---|---|---|---|---|---|---|
| Random Forest | 77 | 76 | 77 | 75 | 76 | 78 | 76 | 74 | 82 | 84 | 82 | 81 |
| Ada Boost | 77 | 77 | 77 | 77 | 74 | 74 | 74 | 73 | 81 | 81 | 81 | 81 |
| Good | ||||||||||||
| Decision Tree | 69 | 71 | 69 | 70 | 66 | 65 | 66 | 65 | 68 | 67 | 68 | 67 |
| Support Vector Machine | 79 | 79 | 79 | 77 | 73 | 71 | 73 | 71 | 71 | 74 | 71 | 71 |
| Gaussian Naïve Bayes | 65 | 67 | 65 | 66 | 73 | 75 | 73 | 74 | 75 | 75 | 75 | 75 |
| Multinomial Naïve Bayes | 60 | 61 | 60 | 60 | 62 | 63 | 62 | 63 | 61 | 61 | 61 | 61 |
| K Nearest Neighbors | 66 | 63 | 66 | 64 | 66 | 63 | 66 | 64 | 51 | 54 | 51 | 52 |
| Poor | ||||||||||||
| Stochastic Gradient Descent | 70 | 49 | 70 | 58 | 70 | 49 | 70 | 58 | 46 | 72 | 46 | 38 |
| One Vs Rest | 70 | 49 | 70 | 58 | 70 | 49 | 70 | 58 | 65 | 78 | 65 | 53 |
Using PyDAAL
The results of classification using PyDAAL algorithms are given in table 7.
Table 7. Experiment Results of PyDAAL.
| Classifiers | Accuracy% | Precision% | Recall% | F1-score% | ||||||||
| Best | ||||||||||||
|---|---|---|---|---|---|---|---|---|---|---|---|---|
| Decision Tree | 74 | 72 | 74 | 72 | ||||||||
| Support Vector Machine | 65 | 79 | 71 | 75 | ||||||||
| Good | ||||||||||||
| Multinomial Naïve Bayes | 62 | 64 | 62 | 63 | ||||||||
| Poor | ||||||||||||
| Ada Boost | 70 | 49 | 70 | 58 | ||||||||
Observations
- Random Forest Classifier and Ada Boost classifier in scikit-learn Intel DAAL are identified as the best classifiers for the given problem.
- There was only a slight improvement in classifier performance when the irrelevant features were removed, but there was a significant improvement in run time.
- Balancing the dataset using the SMOTE algorithm helped produce better results for scikit-learn, whereas there was no improvement in PyDAAL.
- PyDAAL is versatile enough to accommodate data of different memory layouts. Popular libraries used in the data analysis process, like NumPy, can be easily interfaced with Intel DAAL to create numeric tables.
- PyDAAL supports only a few machine-learning algorithms and the highest score is obtained for decision trees.
Conclusion
The scikit-learn algorithms shipped within Intel® Distribution for Python* take advantage of PyDAAL bringing scikit-learn performance to new levels. It is also a richer library in terms of machine-learning algorithms when compared to PyDAAL. Using Intel optimized performance libraries in Intel® Xeon® Gold 6128 processor helped machine-learning applications to make predictions faster. Higher accuracy is obtained for optimized scikit-learn algorithms than PyDAAL algorithms. PyDAAL mainly operates on numeric table data, which allows reduced memory footprint and efficient processing.
About the Authors
Nikhila Haridas is a Technical Consulting Engineer working with the Intel® AI Academy Program.
References
- Intel Distribution for Python
- Intel Optimized Packages for the Intel® Distribution for Python*
- PyDAAL
- German credit dataset
- DAAL: Data structures
- DAAL programming guide
For more complete information about compiler optimizations, see our Optimization Notice.