
Memory Usage Inside the CLR
5.00/5 (11 votes)
Fortunately, there’s a fantastic tool that makes it very easy for us to get an overview of memory usage within the CLR itself. It’s called VMMap and it’s part of the excellent Sysinternals Suite.
Have you ever wondered where and why the .NET Runtime (CLR) allocates memory? I don’t mean the ‘managed’ memory that your code allocates, e.g. via new MyClass(..) and the Garbage Collector (GC) then cleans up. I mean the memory that the CLR itself allocates, all the internal data structures that it needs to make it possible for your code to run.
Note: Just to clarify, this post will not be telling you how you can analyze the memory usage of your code, for that I recommend using one of the excellent .NET Profilers available such as dotMemory by JetBrains or the ANTS Memory Profiler from Redgate (I’ve personally used both and they’re great).
The High-level View
Fortunately, there’s a fantastic tool that makes it very easy for us to get an overview of memory usage within the CLR itself. It’s called VMMap and it’s part of the excellent Sysinternals Suite.
For the post, I will just be using a simple HelloWorld program, so that we can observe what the CLR does in the simplest possible scenario, obviously things may look a bit different in a more complex app.
Firstly, let's look at the data over time, in 1 second intervals. The HelloWorld program just prints to the Console and then waits until you press <ENTER>, so once the memory usage has reached its peak, it remains there till the program exits. (Click for a larger version.)
.png)
However, to get a more detailed view, we will now look at the snapshot from 2 seconds into the timeline, when the memory usage has stabilized.

Note: If you want to find out more about memory usage in general, but also specifically how to measure it in .NET applications, I recommend reading this excellent series of posts by Sasha Goldshtein:
- Mapping the Memory Usage of .NET Applications: Part 1, Windows Memory Recap
- Mapping the Memory Usage of .NET Applications: Part 2, VMMap and MemoryDisplay
- Mapping the Memory Usage of .NET Applications: Part 3, CLR Profiler
Also, if like me, you always get the different types of memory mixed-up, please read this Stackoverflow answer first: What is private bytes, virtual bytes, working set?
‘Image’ Memory
Now we’ve seen the high-level view, let's take a close look at the individual chucks, the largest of which is labeled Image, which according to the VMMap help page (see here for all info on all memory types):
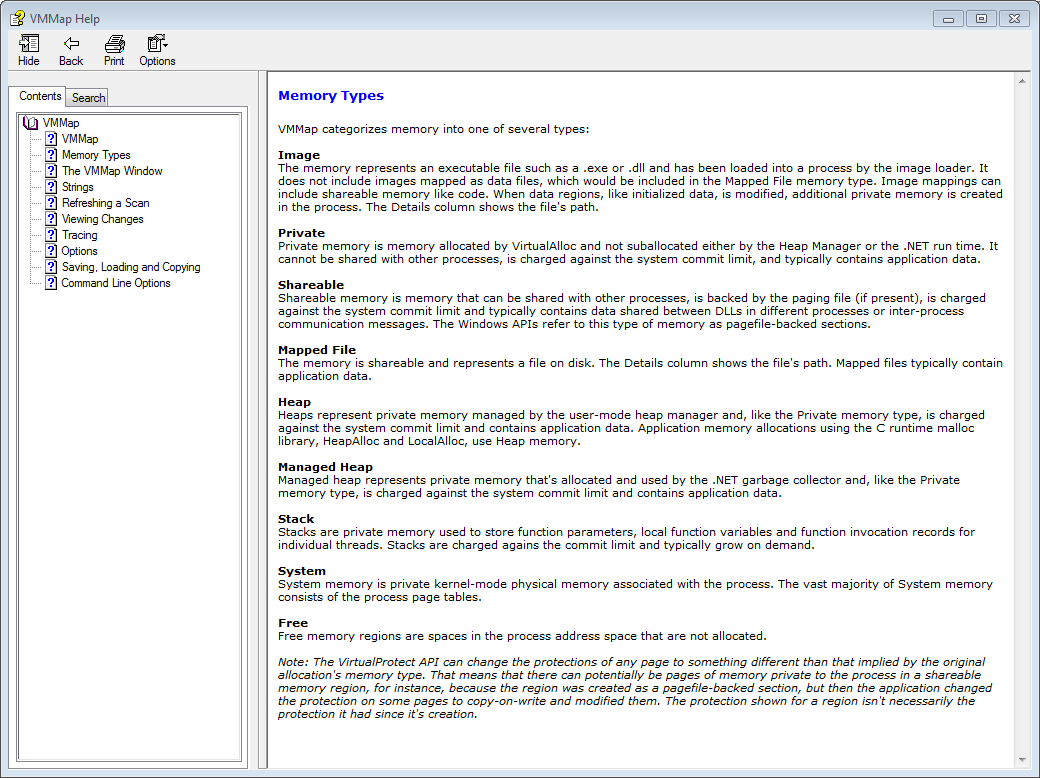
… represents an executable file such as a .exe or .dll and has been loaded into a process by the image loader. It does not include images mapped as data files, which would be included in the Mapped File memory type. Image mappings can include shareable memory like code. When data regions, like initialized data, is modified, additional private memory is created in the process.
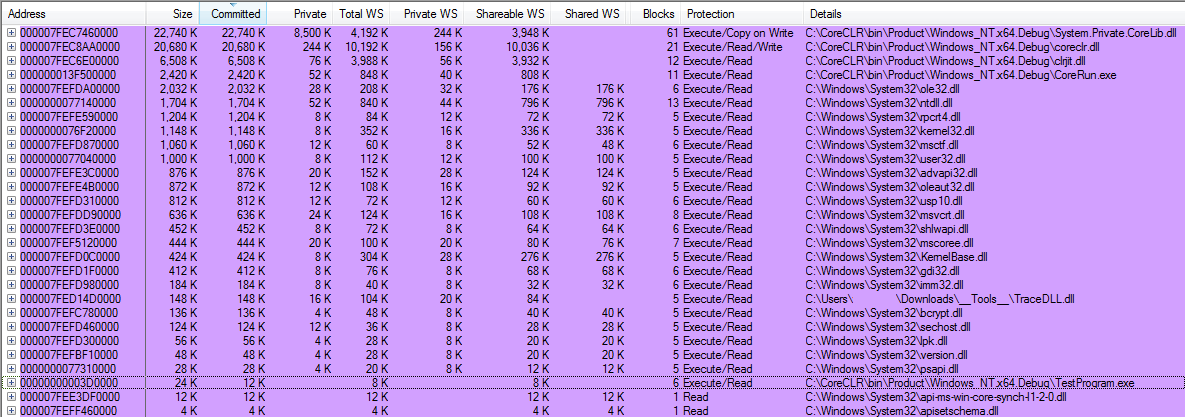
At this point, it’s worth pointing out a few things:
- This memory takes up a large amount of the total process memory because I’m using a simple
HelloWorldprogram, in other types of programs it wouldn’t dominate the memory usage as much. - I was using a
DEBUGversion of the CoreCLR, so the CLR specific files System.Private.CoreLib.dll, coreclr.dll, clrjit.dll and CoreRun.exe may well be larger than if they were compiled inRELEASEmode - Some of this memory is potentially ‘shared’ with other processes, compare the numbers in the ‘
Total WS’, ‘Private WS’, ‘Shareable WS’ and ‘Shared WS’ columns to see this in action.
‘Managed Heaps’ Created by the Garbage Collector
The next largest usage of memory is the GC itself, it pre-allocates several heaps that it can then give out whenever your program allocates an object, for example, via code such as new MyClass() or new byte[].
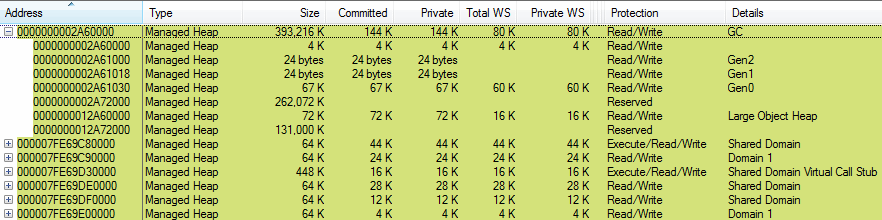
The main thing to note about the image above is that you can clearly see the different heap, there is 256 MB allocated for Generations (Gen 0, 1, 2) and 128 MB for the ‘Large Object Heap’. In addition, note the difference between the amounts in the Size and the Committed columns. Only the Committed memory is actually being used, the total Size is what the GC pre-allocates or reserves up front from the address space.
If you’re interested, the rules for heap or more specifically segment sizes are helpfully explained in the Microsoft Docs, but simply put, it varies depending on the GC mode (Workstation v Server), whether the process is 32/64-bit and ‘Number of CPUs’.
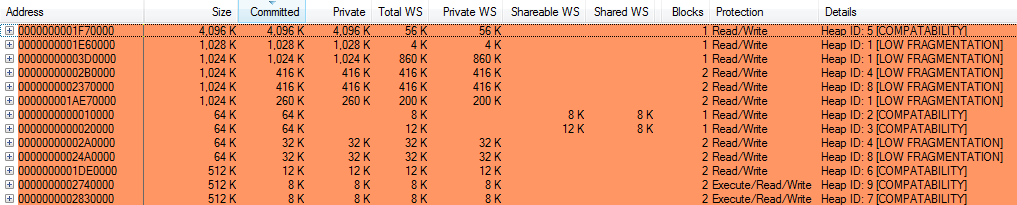
Internal CLR ‘Heap’ Memory
However, the part that I’m going to look at for the rest of this post is the memory that is allocated by the CLR itself, that is unmanaged memory that it uses for all its internal data structures.
But if we just look at the VMMap UI view, it doesn’t really tell us that much!
However, using the excellent PerfView tool, we can capture the full call-stack of any memory allocations, that is any calls to VirtualAlloc() or RtlAllocateHeap() (obviously, these functions only apply when running the CoreCLR on Windows). If we do this, PerfView gives us the following data (yes, it’s not pretty, but it’s very powerful!!)
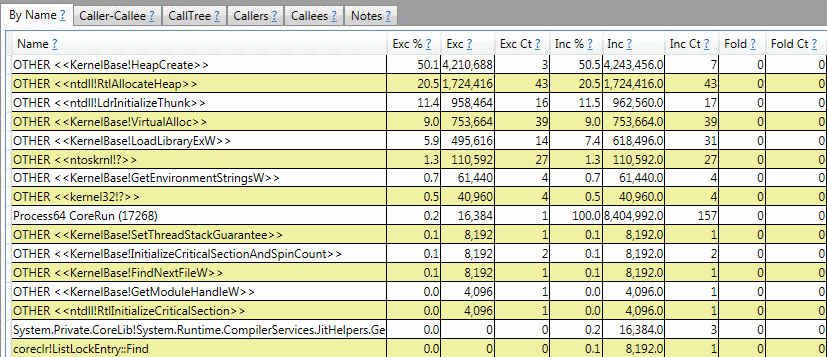
So let's explore this data in more detail.
Notable Memory Allocations
There are a few places where the CLR allocates significant chunks of memory up-front and then uses them through its lifetime, they are listed below:
- GC related allocations (see gc.cpp)
- Mark List - 1,052,672 Bytes (1,028 K) in
WKS::make_mark_list(..). using during the ‘mark’ phase of the GC, see Back To Basics: Mark and Sweep Garbage Collection - Card Table - 397,312 Bytes (388 K) in
WKS::gc_heap::make_card_table(..), see Marking the ‘Card Table’ - Overall Heap Creation/Allocation - 204,800 Bytes (200 K) in
WKS::gc_heap::make_gc_heap(..) - S.O.H Segment creation - 65,536 Bytes (64 K) in
WKS::gc_heap::allocate(..), triggered by the first object allocation - L.O.H Segment creation - 65,536 Bytes (64 K) in
WKS::gc_heap::allocate_large_object(..), triggered by the first ‘large’ object allocation - Handle Table - 20,480 Bytes (20 K) in HndCreateHandleTable(..)
- Mark List - 1,052,672 Bytes (1,028 K) in
- Stress Log - 4,194,304 Bytes (4,096 K) in StressLog::Initialize(..). Only if the ‘stress log’ is activated, see this comment for more information
- ‘Watson’ error reporting - 65,536 Bytes (64 K) in EEStartupHelper routine
- Virtual Call Stub Manager - 36,864 Bytes (36 K) in VirtualCallStubManager::InitStatic(), which in turn creates the DispatchCache. See ‘Virtual Stub Dispatch’ in the BOTR for more information
- Debugger Heap and Control-Block - 28,672 Bytes (28K) (only if debugging support is needed) in DebuggerHeap::Init(..) and DebuggerRCThread::Init(..), both called via InitializeDebugger(..)
Execution Engine Heaps
However, another technique that it uses is to allocated ‘heaps’, often 64K at a time and then perform individual allocations within the heaps as needed. These heaps are split up into individual use-cases, the most common being for ‘frequently accessed’ data and its counter-part, data that is ‘rarely accessed’, see the explanation from this comment in loaderallocator.hpp for more. This is done to ensure that the CLR retains control over any memory allocations and can therefore prevent ‘fragmentation’.
These heaps are together known as ‘Loader Heaps’ as explained in Drill Into .NET Framework Internals to See How the CLR Creates Runtime Objects (wayback machine version):
LoaderHeaps LoaderHeaps are meant for loading various runtime CLR artifacts and optimization artifacts that live for the lifetime of the domain. These heaps grow by predictable chunks to minimize fragmentation. LoaderHeaps are different from the garbage collector (GC) Heap (or multiple heaps in case of a symmetric multiprocessor or SMP) in that the GC Heap hosts object instances while LoaderHeaps hold together the type system. Frequently accessed artifacts like
MethodTables,MethodDescs,FieldDescs, and Interface Maps get allocated on aHighFrequencyHeap, while less frequently accessed data structures, such asEEClassandClassLoaderand its lookup tables, get allocated on aLowFrequencyHeap. TheStubHeaphosts stubs that facilitate code access security (CAS), COM wrapper calls, and P/Invoke.
One of the main places you see this high/low-frequency of access is in the heart of the Type system, where different data items are either classified as ‘hot’ (high-frequency) or ‘cold’ (low-frequency), from the ‘Key Data Structures’ section of the BOTR page on ‘Type Loader Design’:
EEClass
MethodTabledata are split into “hot” and “cold” structures to improve working set and cache utilization.MethodTableitself is meant to only store “hot” data that are needed in program steady state.EEClassstores “cold” data that are typically only needed by type loading, JITing or reflection. EachMethodTablepoints to oneEEClass.
Further to this, listed below are some specific examples of when each heap type is used:
- List of all Low-Frequency Heap usages
- EEClass::operator new (the ‘cold’ scenario above)
- MscorlibBinder::AttachModule(..)
- EETypeHashTable::Create(..)
- COMNlsHashProvider::InitializeDefaultSeed()
- ClassLoader::CreateTypeHandleForTypeKey(..) (when creating function pointers)
- List of all High-Frequency Heap usages
- List of all Stub Heap usages
- MethodDesc::DoPrestub(..) (triggers JIT-ting of a method)
- UMEntryThunkCache::GetUMEntryThunk(..) (a DLL Import callback)
- ComCall::CreateGenericComCallStub(..)
- MakeUnboxingStubWorker(..)
- List of all Precode Heap Usages
- List of all Executable Heap usages
- GenerateInitPInvokeFrameHelper(..)
- JIT_TrialAlloc::GenBox(..) (x86 JIT)
- From comment on GetExecutableHeap() ‘The executable heap is intended to only be used by the global loader allocator.’
All the general ‘Loader Heaps’ listed above are allocated in the LoaderAllocator::Init(..) function (link to actual code), the executable and stub heap have the ‘executable’ flag set, all the rest don’t. The size of these heaps is configured in this code, they ‘reserve’ different amounts up front, but they all have a ‘commit’ size that is equivalent to one OS ‘page’.
In addition to the ‘general’ heaps, there are some others that are specifically used by the Virtual Stub Dispatch mechanism, they are known as the indcell_heap, cache_entry_heap, lookup_heap, dispatch_heap and resolve_heap, they’re allocated in this code, using the specified commit/reserve sizes.
Finally, if you’re interested in the mechanics of how the heaps actually work, take a look at LoaderHeap.cpp.
JIT Memory Usage
Last, but by no means least, there is one other component in the CLR that extensively allocates memory and that is the JIT. It does so in 2 main scenarios:
- ‘Transient’ or temporary memory needed when it’s doing the job of converting IL code into machine code
- ‘Permanent’ memory used when it needs to emit the ‘machine code’ for a method
‘Transient’ Memory
This is needed by the JIT when it is doing the job of converting IL code into machine code for the current CPU architecture. This memory is only needed whilst the JIT is running and can be re-used/discarded later, it is used to hold the internal JIT data structures (e.g. Compiler, BasicBlock, GenTreeStmt, etc).
For example, take a look at the following code from Compiler::fgValueNumber():
...
 // Allocate the value number store.
assert(fgVNPassesCompleted > 0 || vnStore == nullptr);
if (fgVNPassesCompleted == 0)
{
    CompAllocator* allocator = new (this, CMK_ValueNumber) CompAllocator(this, CMK_ValueNumber);
    vnStore                  = new (this, CMK_ValueNumber) ValueNumStore(this, allocator);
}
...
The line vnStore = new (this, CMK_ValueNumber) ... ends up calling the specialized new operator defined in compiler.hpp (code shown below), which as per the comment, uses a customer ‘Arena Allocator’ that is implemented in /src/jit/alloc.cpp.
/*****************************************************************************
 *  operator new
 *
 *  Note that compGetMem is an arena allocator that returns memory that is
 *  not zero-initialized and can contain data from a prior allocation lifetime.
 *  it also requires that 'sz' be aligned to a multiple of sizeof(int)
 */

inline void* __cdecl operator new(size_t sz, Compiler* context, CompMemKind cmk)
{
    sz = AlignUp(sz, sizeof(int));
    assert(sz != 0 && (sz & (sizeof(int) - 1)) == 0);
    return context->compGetMem(sz, cmk);
}
This technique (of overriding the new operator) is used in lots of places throughout the CLR, for instance, there is a generic one implemented in the CLR Host.
‘Permanent’ Memory
The last type of memory that the JIT uses is ‘permanent’ memory to store the JITted machine code, this is done via calls to Compiler::compGetMem(..), starting from Compiler::compCompile(..) via the call-stack shown below. Note that as before, this uses a customer ‘Arena Allocator’ that is implemented in /src/jit/alloc.cpp.
+ clrjit!ClrAllocInProcessHeap
 + clrjit!ArenaAllocator::allocateHostMemory
  + clrjit!ArenaAllocator::allocateNewPage
   + clrjit!ArenaAllocator::allocateMemory
    + clrjit!Compiler::compGetMem
     + clrjit!emitter::emitGetMem
      + clrjit!emitter::emitAllocInstr
       + clrjit!emitter::emitNewInstrTiny
        + clrjit!emitter::emitIns_R_R
         + clrjit!emitter::emitInsBinary
          + clrjit!CodeGen::genCodeForStoreLclVar
           + clrjit!CodeGen::genCodeForTreeNode
            + clrjit!CodeGen::genCodeForBBlist
             + clrjit!CodeGen::genGenerateCode
              + clrjit!Compiler::compCompile
Real-world Example
Finally, to prove that this investigation matches with more real-world scenarios, we can see similar memory usage breakdowns in this GitHub issue: [Question] Reduce memory consumption of CoreCLR
Yes, we have profiled several Xamarin GUI applications on Tizen Mobile.
Typical profile of CoreCLR’s memory on the GUI applications is the following:
- Mapped assembly images - 4.2 megabytes (50%)
- JIT-compiler’s memory - 1.7 megabytes (20%)
- Execution engine - about 1 megabyte (11%)
- Code heap - about 1 megabyte (11%)
- Type information - about 0.5 megabyte (6%)
- Objects heap - about 0.2 megabyte (2%)
Further Reading
See the links below for additional information on ‘Loader Heaps’:
- Drill Into .NET Framework Internals to See How the CLR Creates Runtime Objects (wayback machine version)
- C# Different Types Of Heap Memory
- Need clarification : Loader Heap , High Frequency heap and method tables
- MANAGED DEBUGGING with WINDBG. Managed Heap. Part 5
- .NET process memory usage = 5x CLR Heap Memory?
- what is the difference between object and loader heap in .net 4.0
- 2,000 Things You Should Know About C# - #200 – Static Data and Constants Are Stored on the Heap
- High Frequency Heap - Can anyone explain me the CLR’s “HighFrequencyHeap”?
- To help clarify the discussion on the heaps here, there are about 8 different heaps that the CLR uses
- Issues about ‘[Memory Consumption]’
The post Memory Usage Inside the CLR first appeared on my blog Performance is a Feature!