
Sql Server In Clause With Multiple Literal Values Performance Behaviour
4.50/5 (2 votes)
This article deals with performance difference with literal values
Introduction
Starting my first article on in clause with constant literal values, where we will explore the behavior changes of the optimizer. How it treats and processes internally this condition with the constant literal values. And what other alternatives are available for the subquery.It’s good to know the query optimizer default behavior, So you can make the most of it and might influence the optimizer (in a better way) to go through the different access path and treat query differently to bring a better execution plan for the query, even without indexing, don’t get me wrong indexing is good but something you don’t want to index every other column.
Before I start this article we should remember that sql server is a declarative language and the query engine doesn`t execute a sql query as it is submitted to it. Loosely speaking when the query submitted to sql server, it parses the query check for the semantics and then create an equivalent logical tree to match the provided query, then logical tree go through multiple optimization phases to get a “good enough” query plan,
The query optimizer is a great piece of software and its primary goal is to come up with good execution plan with as little as time taken to generate a physical executable execution plan.In most cases the query optimizer creates multiple alternative physical execution plan and chooses one which plan has the lowest overall cost.
I am certain whosoever uses sql does use in as an alternative of multiple “or” as a shorthand, to avoid the repetitive condition. It's good we have in clause in the sql language, Think how hard it would be if we have to write multiple ‘or’ clause 100 times for the same column.
In condition is very common across the databases to pass multiple predicates, because repeating multiple or for the same column does look quite lengthy, so there is a shorthand available in the form of in the clause.
For example:
Where id = 1 or id=2 or id = 3 can be written as where id in (1,2,3)
Quick Refresher Below:
A subquery matches the test_expression then it returns True, Otherwise False.And if a subquery contains a null value, then can return unexpected results based on ansi null setting for the session/database.If redundant data present, then removed from the subquery.And if extremely large number of values (many thousands) provided in the in clause, It can consume resources and return errors 8623 or 8632. Further reading here.
Back On Topic
Below I have created a random table with some random data, to test the in clause behavior with the literal values. As far as I know this topic hasn’t been touched by anyone, Don`t know the reason, So better get started :)
Below is a testable script filling it with the testdata
CREATE TABLE DBO.TestTable (

      ID INT IDENTITY(1, 1) NOT NULL

      ,IDvarchar AS Cast(ID AS VARCHAR(50)) PERSISTED NOT NULL

      ,intcolumn INT

      ,NAME VARCHAR(50) NOT NULL

      ,Age INT NOT NULL

      ,Randomvalue BIGINT

      );

INSERT INTO TestTable (

      intcolumn

      ,NAME

      ,AGE

      )

SELECT s1.number

      ,'Some Random Data..'

      ,s1.number % 10 + 25

FROM master.dbo.spt_values s1

CROSS JOIN master.dbo.spt_values s2;

UPDATE TestTable

SET Randomvalue = Cast(rand(checksum(newid())) * ID AS INT);

ALTER TABLE TestTable

ALTER COLUMN Randomvalue INT NOT NULL;

UPDATE STATISTICS TestTable WITH fullscan;
Before getting started, some point to considerations are:
- The Table is heap
- There is no useful index on it
- Lookup column consists unique integer values
- Literal values are existing in the table
- QO is limited to, use 1 thread (parallelism disable)
- The execution plan is non-Trivial.
To measure the performance difference, I have created a script that runs against the provided constant literal values with a loop and calculate the total time taken in executing those values and put the result in a temporary table.The Result is assigned to a local variable just to restrict sending data to ssms grid.
For example:
–1st query will execute as
Select @ID=ID , @IDVARCHAR=IDvarchar ,@INTCLOUMN=intcolumn, @NAME=Name ,@AGE=Age ,@RANDOMVALUE=Randomvalue
from TestTable
where id in
(
3279615
)
–2nd query will execute as
Select @ID=ID , @IDVARCHAR=IDvarchar ,@INTCLOUMN=intcolumn, @NAME=Name ,@AGE=Age ,@RANDOMVALUE=Randomvalue from TestTable
where id in
(
3279615, 2619534\
)
–3d query will execute as
@ID=ID , @IDVARCHAR=IDvarchar ,@INTCLOUMN=intcolumn, @NAME=Name ,@AGE=Age ,@RANDOMVALUE=Randomvalue from TestTable
where id in
(
3279615, 2619534, 2932146
)
And so on …. upto 99 values
THE SCRIPT :
Create Table  #counter (variablecount INT , Duration INT

    )

DECLARE @values NVARCHAR(max)

SELECT @values = (

'3279615,  2619534,  2932146,  4953386,  2818224,  5244141,  2321234,  4670287,  3600354,  4307158,  4668756,  4049137,  3037542,  4483522,  3660501,  4426646,  3110987,  2709820,  2818736,  4875826,  2029820,  5467223,  2316672,  2080036,  3781872,  5120161,  4231500,  2885329,  2186636,  4273746,  4469182,  4682959,  3905551,  3206172,  2911743,  4275209,  3789552,  2341547,  2943986,  5229815,  2867115,  2402580,  2943328,  3125357,  4816147,  4219152,  3825625,  3221610,  5052178,  4742174,  2182772,  4934910,  5196299,  3803372,  5041037,  4261499,  5266382,  3667876,  3467411,  2574704,  3941358,  3785855,  4258958,  4565076,  5274231,  3203938,  5329843,  4438383,  2312628,  3248408,  3743514,  4552594,  4109833,  4388393,  5064054,  2054373,  3715411,  3761234,  5470921,  5197951,  4356672,  3309015,  3767928,  2372922,  3858804,  3617027,  3247204,  2105261,  2846260,  3053944,  4398447,  3246406,  4326008,  2506261,  5404760,  2410146,  3578365,  2753024,  3164078,  4087679'

            )

DECLARE @dynamicsql NVARCHAR(max)

DECLARE @loop INT

      ,@LoopCount INT

SET @loop = 7

SET @LoopCount = 1

WHILE (@loop < 997)

BEGIN

      SET @dynamicsql = 'declare @Beforeexecutiontime datetime

declare @Aeforeexecutiontime datetime

declare @ID int

declare @IDvarchar varchar(50)

declare @INTCLOUMN int

declare @Name varchar(50)

declare @Age int

declare @Randomvalue bigint

Set @Beforeexecutiontime=getdate()

Select @ID=ID , @IDVARCHAR=IDvarchar ,@INTCLOUMN=intcolumn, @NAME=Name ,@AGE=Age ,@RANDOMVALUE=Randomvalue from TestTable

where id in

(' + Convert(NVARCHAR(max), left(@values, @loop)) + ')

option (MAXDOP 1)

SET @Aeforeexecutiontime =getdate()

INSERT INTO #counter

select ' + Convert(NVARCHAR(10), @LoopCount) + ',datediff (MS ,@Beforeexecutiontime ,@Aeforeexecutiontime)

'

      EXEC (@dynamicsql)

      SET @loop = @loop + 10

      SET @LoopCount = @LoopCount + 1

      SET @dynamicsql = ''

END

SELECT *

FROM #counter

ORDER BY variablecount
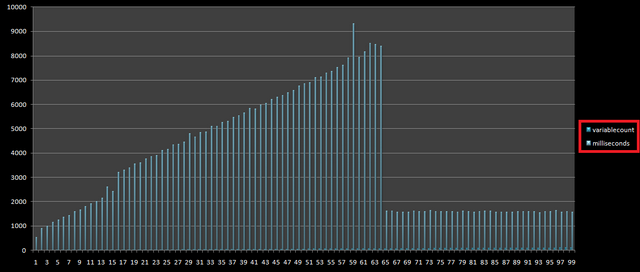
RESULTS ARE ON MY SYSTEM
Microsoft SQL Server 2014 – 12.0.2000.8 (X64) (Build 7601: Service Pack 1)

Microsoft SQL Server 2012 – 11.0.2100.60 (Intel X86) (Build 7601: Service Pack 1)
Microsoft SQL Server 2008 R2 (RTM) – 10.50.1600.1 (X64) (Build 7601: Service Pack 1)

Microsoft SQL Server 2005 - 9.00.3042.00 (Intel X86) (Build 7601: Service Pack 1)

Notice, the execution time variation, when the literal values count reaches 16 and then improvement when it reaches 65 and above why? Why processing is fast again when it reach 65.For anybody, whosoever experienced the results will come to the conclusion that it shouldn`t happen, because if sql server query optimizer is able to Speed up processing against 65 literal values and above then it should be able to do it for rows 10 to 64 rows as well no?
What are the results of your system?
Reason
As you might already know that sql server is a declarative language, we have just submitted a sql statement to the sql engine, and now It’s on sql server how to execute it internally.
This part is concentrated only on the reasons what sudden changes happen in the plan that made the query run faster.So let`s see how multiple predicates handled by the query optimizer for 2 values. To get it more clear understanding I`ll use statistics io and execution plan
SET STATISTICS IO ON

SELECT *

FROM testtable

WHERE id IN (

            3279615

            ,2619534

            )

OPTION (MAXDOP 1)
Results on my system are:
Table 'TestTable'. Scan count 1, logical reads 37168
Even for 2 distinct values scan count is just "1" that shows the table has scanned just once against both the literal values and of course that’s the better option to scan for multiple values, Especially when no supporting index on the table. In that situation, my imaginary pseudo-code goes like:

Now look at the tab Execution plan,the execution plan for above query shows:

Placing cursor on the table scan iterator, on the bottom it shows that in clause values has converted into multiple or by sql server.This goes exactly up to 15 distinct literal values. So now check what happen when we use 16th literal value.
--16th literal value
SET STATISTICS IO ON

SELECT *

FROM testable

WHERE id IN (

            3279615,2619534,2932146,4953386,2818224,5244141

            ,2321234,4670287,3600354,4307158,4668756,4049137

            ,3037542,4483522,3660501,3110987

            )

OPTION (MAXDOP 1)
Output of statistics io on the message tab says: Table 'TestTable'. Scan count 1, logical reads 37618. So the Scan count is still “1”, nothing much revealed by the statistical information. Now lets check the execution plan of the above query.

There is an additional filter iterator, placing cursor over the iterator it shows:
Restricting the set of rows based on a predicate. If it`s restricting the rows based on a predicate, then how was this process was happening earlier? Filtering was actually happening earlier as well, but filter predicate was combined with a table scan iterator to avoid a separate Filter plan operator and reduce the cost of passing rows between the filter and scan operator, and the 15 distinct literal values is the limit here. Now we can see now both Iterators are independent of each other, IF you look at bol for the explanation of the filter predicate here what you will get:

However, there are many cases as well where you see filter predicate. For example: having clause, where clause with case statement and against non table filtration etc. So because after 16 distinct literal values it changes the way it accesses the data physically. Thus, there was a slight difference in the performance. Now let`s look what happen after 65 distinct literal values because its scale quite well.
-- 65 Literal Values

SET STATISTICS TIME ON

SELECT *

FROM testtable

WHERE id IN (

3125357 , 3164078, 3203938, 3206172, 3221610, 3246406, 3247204, 3248408,

3309015, 5266382, 5274231, 3467411, 5329843, 3578365, 3600354, 2312628,

2316672, 2321234, 4219152, 4231500, 4258958, 4261499, 4273746, 4275209,

4326008, 4356672, 4388393, 4398447, 4426646, 4438383, 4469182, 4483522,

4552594, 4565076, 5404760, 5467223, 5470921, 2341547, 2372922, 2402580,

4668756, 4670287, 4682959, 2410146, 2506261, 2574704, 2619534, 2709820,

2753024, 2818224, 2818736, 2029820, 2846260, 2867115, 2885329, 2054373,

2080036, 2932146, 2105261, 2943328, 2943986, 3279615, 4307158,3617027,

2911743


)

OPTION (MAXDOP 1)

GO

Semantically, we did not change anything in the statement, statistics io don`t reveal much above, but execution plan does.Now the internal processing has changed completely, and right semi join Introduced in the plan selection with a constant scan iterator, and because of that execution time has reduced, now query optimizer treating literal values as a collection of values as a constant scan iterator and then joining test table on the ID column. Constant scan holds all the literal values in the memory, hashing literal values and probing ids of testtable. However, hash match is the efficient method here, but a bit memory consuming compared to filtrations earlier. On my system 1888 KB additional memory grant is required to process this hash join, You can check memory grant of query being executed with dmv sys.dm_exec_query_memory_grants or placing cursor over leftmost select Iterator in actual/post execution plan. You might know that sql server use rules to enable physical implementation, Here it uses "ConstGetToConstScan" to enable constant scan iterator.
On the hash match join sql server applies the residual predicate on sql server 2012 and above build:

Expr1003 is the column name of the integer type literal constant values, that I wasn’t expecting as there is no mismatch in the data type of nether we have nulls in our literal value collection, As its behavior (Probe Residual) wasn`t in the earlier versions of sql server until you add explicit mismatch data type in the collection of literal values that there is must be a solid reason to have a residual predicate against literal values on the place.
Final part
I believe, even in the mid of this article you already knew how to fix this kind of behavior either with Table variable or Temp table.As the above query isn`t complex, the final data are received by select iterator`s estimated values doesn`t matter here, so I am choosing table variable either with trace flag 2453 (Please read the KB article for further info) or statement level recompilation,
But if my query would have more complex than I might use temp table to just not to fall into the plan regression as the temp table uses histogram`s values more effectively.So let`s go ahead and insert 64 constant literal values in the temp variable and see how it works.
DECLARE @LitralCollection AS TABLE (LValue INT NOT NULL)

-- 64 Literal Values

INSERT INTO @LitralCollection

Select 3125357  Union ALL    Select  3164078 Union ALL    Select  3203938 Union ALL

Select  3206172 Union ALL    Select  3221610 Union ALL    Select  3246406 Union ALL

Select  3247204 Union ALL    Select  3248408 Union ALL    Select  3279615 Union ALL

Select  3309015 Union ALL    Select  5266382 Union ALL    Select  5274231 Union ALL

Select  3467411 Union ALL    Select  5329843 Union ALL    Select  3578365 Union ALL

Select  3600354 Union ALL    Select  2312628 Union ALL    Select  2316672 Union ALL

Select  2321234 Union ALL    Select  4219152 Union ALL    Select  4231500 Union ALL

Select  4258958 Union ALL    Select  4261499 Union ALL    Select  4273746 Union ALL

Select  4275209 Union ALL    Select  4307158 Union ALL    Select  4326008 Union ALL

Select  4356672 Union ALL    Select  4388393 Union ALL    Select  4398447 Union ALL

Select  4426646 Union ALL    Select  4438383 Union ALL    Select  4469182 Union ALL

Select  4483522 Union ALL    Select  4552594 Union ALL    Select  4565076 Union ALL

Select  2372922 Union ALL    Select  2402580 Union ALL    Select  3617027 Union ALL

Select  4682959 Union ALL    Select  2410146 Union ALL    Select  2506261 Union ALL

Select  2709820 Union ALL    Select  2753024 Union ALL    Select  2818224 Union ALL

Select  2846260 Union ALL    Select  2867115 Union ALL    Select  2885329 Union ALL

Select  2080036 Union ALL    Select  2932146 Union ALL    Select  2105261 Union ALL

Select  5404760 Union ALL    Select  5467223 Union ALL    Select  5470921 Union ALL

Select  2341547 Union ALL    Select  4668756 Union ALL    Select  4670287 Union ALL

Select  2574704 Union ALL    Select  2619534 Union ALL    Select  2818736 Union ALL

Select  2029820 Union ALL    Select  2054373 Union ALL    Select  2911743 Union ALL

Select  2943328


SELECT *

FROM testtable

WHERE id IN (

            SELECT Lvalue

            FROM @LitralCollection

            )

OPTION (MAXDOP 1,Recompile)

Elapsed time = 1291 ms.
Without temp variable compared to 64 literal values:
-- 64 Literal Values

SELECT *

FROM testtable

WHERE id IN (

3125357 ,   3164078 ,   3203938 ,   3206172 ,   3221610 ,   3246406 ,   3247204 ,   3248408 ,   3279615 ,

3309015 ,   5266382 ,   5274231 ,   3467411 ,   5329843 ,   3578365 ,   3600354 ,   2312628 ,   2316672 ,

2321234 ,   4219152 ,   4231500 ,   4258958 ,   4261499 ,   4273746 ,   4275209 ,   4307158 ,   4326008 ,

4356672 ,   4388393 ,   4398447 ,   4426646 ,   4438383 ,   4469182 ,   4483522 ,   4552594 ,   4565076 ,

5404760 ,   5467223 ,   5470921 ,   2341547 ,   2372922 ,   2402580 ,   3617027 ,   4668756 ,   4670287 ,

4682959 ,   2410146 ,   2506261 ,   2574704 ,   2619534 ,   2709820 ,   2753024 ,   2818224 ,   2818736 ,

2029820 ,   2846260 ,   2867115 ,   2885329 ,   2054373 ,   2911743 ,   2080036 ,   2932146 ,   2105261 ,

2943328

)

OPTION (MAXDOP 1)

Elapsed time = 6147 ms.
Did you notice in the execution plan, while feeding all literal values to temp variable query optimizer made a collection of values as a Constant Scan iterator and feed all the rows in one go in the temp variable, so rather feeding it to temp variable let's use the collection directly in the query.
SELECT *

FROM testtable

WHERE id IN (

Select 3125357  Union ALL    Select  3164078 Union ALL    Select  3203938 Union ALL

Select  3206172 Union ALL    Select  3221610 Union ALL    Select  3246406 Union ALL

Select  3247204 Union ALL    Select  3248408 Union ALL    Select  3279615 Union ALL

Select  3309015 Union ALL    Select  5266382 Union ALL    Select  5274231 Union ALL

Select  3467411 Union ALL    Select  5329843 Union ALL    Select  3578365 Union ALL

Select  3600354 Union ALL    Select  2312628 Union ALL    Select  2316672 Union ALL

Select  2321234 Union ALL    Select  4219152 Union ALL    Select  4231500 Union ALL

Select  4258958 Union ALL    Select  4261499 Union ALL    Select  4273746 Union ALL

Select  4275209 Union ALL    Select  4307158 Union ALL    Select  4326008 Union ALL

Select  4356672 Union ALL    Select  4388393 Union ALL    Select  4398447 Union ALL

Select  4426646 Union ALL    Select  4438383 Union ALL    Select  4469182 Union ALL

Select  4483522 Union ALL    Select  4552594 Union ALL    Select  4565076 Union ALL

Select  2372922 Union ALL    Select  2402580 Union ALL    Select  3617027 Union ALL

Select  4682959 Union ALL    Select  2410146 Union ALL    Select  2506261 Union ALL

Select  2709820 Union ALL    Select  2753024 Union ALL    Select  2818224 Union ALL

Select  2846260 Union ALL    Select  2867115 Union ALL    Select  2885329 Union ALL

Select  2080036 Union ALL    Select  2932146 Union ALL    Select  2105261 Union ALL

Select  5404760 Union ALL    Select  5467223 Union ALL    Select  5470921 Union ALL

Select  2341547 Union ALL    Select  4668756 Union ALL    Select  4670287 Union ALL

Select  2574704 Union ALL    Select  2619534 Union ALL    Select  2818736 Union ALL

Select  2029820 Union ALL    Select  2054373 Union ALL    Select  2911743 Union ALL

Select  2943328

)

OPTION (MAXDOP 1)

Elapsed time = 1162 ms.
Now the Query optimizer final choice of execution plan has changed as you can see
In the execution plan above Inner side is a constant scan (collection of all literal values in memory) joining Testtable with hash match as physical join Iterator.Interestingly, on the probe side there is an additional filter predicate ( [TEST1].[dbo].[TestTable].[ID]>=(2029820) AND [TEST1].[dbo].[TestTable].[ID]<=(5470921) ).
2029820 and 5470921 is the minimum and maximum values present in the Collection of constant literal values.So the probe side is passing only 250 MB of data to hash match join which was earlier 478 MB of data. This transformation doesn’t always pay well specifically when literal collection `s, maximum and minimum values are in wide range or bitmap is pushed down to probe table in parallel plan.
Summary
In this post, I only focused on in clause behavior with literal values on the table, where we have no supporting index. I showed how after 16th and 65th literal value execution time and plan changed and how to deal with these situations when it’s bothering you.But if you have supporting index you no need to worry that situation, check yourself its fun ;)