
How to identify worst performing queries & improve their performance
4.20/5 (7 votes)
This article is all about how to identify the worst performing queries in the running application or some specific module of the aplication.
Introduction
Sometimes we have in our mind that we want to improve performance of some application (specially for maintenance applications) or it may be possible that we want to validate and improve performance of a specific module (developed inside an existing application) . But the question comes in mind is that from where we have to start or we can say which area we should check.
One of these area to start with could be to check the performance of queries which are executed by the application to deal with the database. Later to identifies the worst performing queries so that we can focus on some specific queries in order to improve the performance of these queries and if we are successful in improving the query performance then definitely it will improve the performance of application significantly.
We will learn here how to identify the worst performing queries without having any idea of which queries are executed behind the scenes.
Background
Whenever a new module is developed in an existing application then there is always a point in mind whether the performance of this module will be inline with the application o not. Sometime we have cutoff limits for the performance of application (for e.g.. any page of application should not take more than 3 seconds). There could be phases of SDLC where this could be check like as performance testing but this happens at a later stag when we can say the new development is functionally secure (after Coding, UT, IT and QA or may be after VAFC, UAT). Any identification of worst performing scenario could lead to such technical changes in a manner that we need to perform some phases again just to secure the new changes.
Therefore by doing some POC and analysis we come out some process or step by step execution which could help to identify these scenarios at earlier stages and we can do significant changes at earlier stage.
Requirements
To perform these steps to identify the worst performing queries we need some configurations to be done as defined below
- A separate environment having release (application) installed on it and none other user is going to use this environment until the task is completed.
- A separate database instance so that no unnecessary query execution is done by any other user in order to observe the only required queries performance.
In short we can say that we should prefer to have a dedicated environment for these execution to be done.
Now as we have environments prepared then we should also know in advance that what behavior we are going to check/ test or we can say to identify the functional scenarios to be validated.
For each such scenarios we need to identify following information prior to execution of scenarios.
- Functional scenario to be performed
- Observation of performance of query in terms of (any one or all of them)
- CPU TIME
- Duration
- Logical Reads
- Projected Data Volume (Means if I am going to test a scenarios which fetches data from database based on some criteria then what should be maximum data present in table )
- Prepare Scripts to populate data in database tables (Test data) if we do not have data present as per projected volume.
For example: See the below test case to be performed
|
Detailed View search: Following scenarios have been executed for this Subject:
|
|
Using the code
To start the execution of scenarios first of all we need to clear the cache of SQL Server so that results are not affected by some cached data or we can say if there are already some queries executed on this environment that may affect results
Execute following queries with DBO permissions
DBCC FREESYSTEMCACHE('All')
DBCC FREESESSIONCACHE
DBCC DROPCLEANBUFFERS
DBCC FREEPROCCACHE
Run SQL profiler in background so that executed queries are also tracked in profiler window which will help to see some artifacts related to queries.
After clearing the cache of DB server execute all required scenarios which we have listed to be executed and after execution of all scenarios stop the SQL profiler and save it for later to be used.
Now our task is to identify the worst performing queries among the all queries executed because of execution of scenarios. The query can be worst performing on three parameters defined as below
- CPU time
- Duration of execution
- Logical/Physical reads
We have prepared queries (each for one of above three parameters) to identify the worst performing queries. These queries needs to be executed just after all the scenarios are executed and results are to be kept. Here are the queries.
To get the worst performing queries order by no of execution execute following SQL query (Select Top 20 worst performing queries.
select top 20
                stat.execution_count as execution_count,
                stat.total_logical_reads as total_logical_read,
                stat.total_worker_time as total_CPU,
                cache.objtype,
                req.text,
                '1 Execution count' as typeOf,
                row_number() OVER (ORDER BY stat.execution_count desc) as rownum
from sys.dm_exec_query_stats AS stat
CROSS APPLY sys.dm_exec_sql_text(stat.sql_handle) as req
CROSS APPLY    sys.dm_exec_query_plan(stat.plan_handle)    AS pl
left join sys.dm_exec_cached_plans as cache on cache.plan_handle = stat.plan_handle
order by execution_count desc
To get the worst performing queries order by logical reads execute following SQL query (Select Top 20 worst performing queries.
select top 20
                stat.execution_count as execution_count,
                stat.total_logical_reads as total_logical_read,
                stat.total_worker_time as total_cpu,
                cache.objtype,
                req.text,
                '3 Logical Read' as typeOf,
                row_number() OVER (ORDER BY stat.total_logical_reads desc) as rownum
from sys.dm_exec_query_stats AS stat
CROSS APPLY sys.dm_exec_sql_text(stat.sql_handle) as req
CROSS APPLY    sys.dm_exec_query_plan(stat.plan_handle)    AS pl
left join sys.dm_exec_cached_plans as cache on cache.plan_handle = stat.plan_handle
order by total_logical_read desc
To get the worst performing queries order by CPU time execute following SQL query (Select Top 20 worst performing queries.
select top 20
                stat.execution_count as execution_count,
                stat.total_logical_reads as total_logical_read,
                stat.total_worker_time as total_cpu,
                cache.objtype,
                req.text,
                '2 CPU' as typeOf,
                row_number() OVER (ORDER BY stat.total_worker_time desc) as rownum
from sys.dm_exec_query_stats AS stat
CROSS APPLY sys.dm_exec_sql_text(stat.sql_handle) as req
CROSS APPLY    sys.dm_exec_query_plan(stat.plan_handle)    AS pl
left join sys.dm_exec_cached_plans as cache on cache.plan_handle = stat.plan_handle
order by total_cpu desc
Moreover if we are trying to find worst performing queries on all above three parameters then we can club these queries into a single queries and can get the desired result. The combined query will look like as follows.
select * from
-- CPU cache SQL-Server
(select top 20
                stat.execution_count as execution_count,
                stat.total_logical_reads as total_logical_read,
                stat.total_worker_time as total_cpu,
                cache.objtype,
                req.text,
                '2 CPU' as typeOf,
                row_number() OVER (ORDER BY stat.total_worker_time desc) as rownum
from sys.dm_exec_query_stats AS stat
CROSS APPLY sys.dm_exec_sql_text(stat.sql_handle) as req
CROSS APPLY    sys.dm_exec_query_plan(stat.plan_handle)    AS pl
left join sys.dm_exec_cached_plans as cache on cache.plan_handle = stat.plan_handle
order by total_cpu desc
union
select top 20
                stat.execution_count as execution_count,
                stat.total_logical_reads as total_logical_read,
                stat.total_worker_time as total_cpu,
                cache.objtype,
                req.text,
                '3 Logical Read' as typeOf,
                row_number() OVER (ORDER BY stat.total_logical_reads desc) as rownum
from sys.dm_exec_query_stats AS stat
CROSS APPLY sys.dm_exec_sql_text(stat.sql_handle) as req
CROSS APPLY    sys.dm_exec_query_plan(stat.plan_handle)    AS pl
left join sys.dm_exec_cached_plans as cache on cache.plan_handle = stat.plan_handle
order by total_logical_read desc
union
select top 20
                stat.execution_count as execution_count,
                stat.total_logical_reads as total_logical_read,
                stat.total_worker_time as total_cpu,
                cache.objtype,
                req.text,
                '1 Execution count' as typeOf,
                row_number() OVER (ORDER BY stat.execution_count desc) as rownum
from sys.dm_exec_query_stats AS stat
CROSS APPLY sys.dm_exec_sql_text(stat.sql_handle) as req
CROSS APPLY    sys.dm_exec_query_plan(stat.plan_handle)    AS pl
left join sys.dm_exec_cached_plans as cache on cache.plan_handle = stat.plan_handle
order by execution_count desc)
as stat
order by typeof, rownum
Execution of above combined query will return total 60 (Top20 + Top 20 + Top 20) rows and each row will contain a sql query which is performing worst on one of above three parameters. It is also possible that some sql query is performing worst on more than one parameter. Now we have to simply check each query and have to take action as follows.
- Get the query and execute it is separate SQL tab to see the artifacts like CPU time, logical reads, INDEX are being scanned or seek (can be seen from execution plan).
- If individual thinks that he/she can work on the query to improve the performance then should start working on it or may be he/she can contact their DBA. The plus point here will be that he/she has worst performing query with the artifacts which will also help DBA to start and also less time will be required.
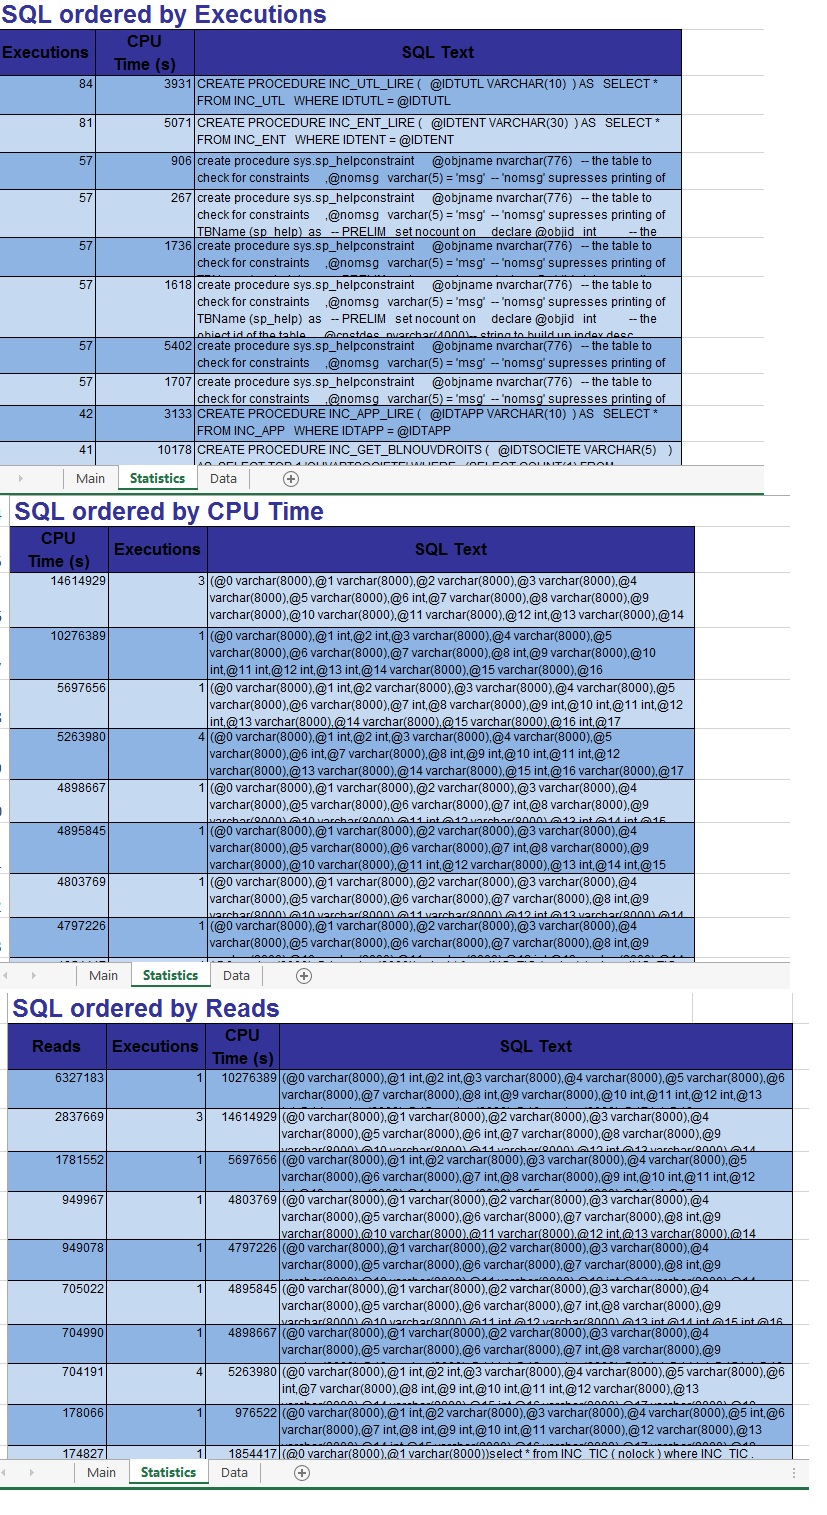
To make it easier to work on worst performing queries returned by above SQL combined query we have prepared an EXCEL file which will have three different sheets and a macro which will read the result from a specific sheet and will arrange the results in another sheet. See attached images below.
- Main Sheet : This sheet will contains information about the database on which the steps are performed and also it will have list of parameters on which performance of queries are observed.

2. Data Sheet: This is sheet where all the results returned by the query are pasted see below image

3. Statistics Sheet: This is the final sheet where all the results are displayed category wise and in descending order of artifacts of worst performing queries. See below image
Therefore we will have a final results sheet which will have all listed all worst performing queries identified. To help the process I have attached the Excel sheet and it can be downloaded by link provided on top.
As we have identified the appropriate worst performing queries therefore our next step is to analyze and improve the performance of query if required. This can be done by any individual if seems feasible otherwise a DBA should be referred for the same.
But for the interested people who wants to do it by themselves here is example given below just to demonstrate How they can start. This is not the only approach to deal with these issue but we can say it could be a direction in which one may move forward to start.
Suppose i found the following scenario in which the query is performing worst
Query for search product tickets with status closed: Following query is executed in this search case.
SET ROWCOUNT 101;
SELECT INC_TIC.IDTTIC, INC_TIC.IDTCLSSYS, INC_TIC.DSCTIC, INC_TIC.DATDEBTIC, INC_TIC.DERETATIC , INC_TIC.IDTPRD, INC_TIC.IDTCOM, INC_TIC.IDTTCH, INC_TIC.IDTSEC, INC_TIC.VALIDTPRM4 , INC_TIC.IDTPRM1, INC_TIC.IDTPRM2, INC_TIC.IDTPRM3, INC_TIC.IDTPRM4  , INC_PRD.IDTPRD as NMGPRD, INC_PRD.EXTPRD, INC_PRD.CMPOFFCOD, INC_PRD.CMPOFFLBL , INC_TYPPRD.IDTAPT, INC_TYPPRD.IDTFAMPRD, INC_TIC.RAISOCPHO , INC_TIC.IDTTYPPRD, INC_TIC.CODGTR, INC_TIC.IDTCTR , INC_TIC.IDTPLGHOR, INC_TIC.VALGTR
FROM INC_TIC
LEFT JOIN INC_PRD ON INC_PRD.IDTPRD=INC_TIC.IDTPRD AND INC_TIC.INDBDDPRD='OCE'
INNER JOIN INC_TYPPRD ON INC_TYPPRD.IDTTYPPRD=INC_TIC.IDTTYPPRD
WHERE INC_TIC.IDTCLSSYS=1 AND INC_TIC.DERETATIC = 5
AND EXISTS(  SELECT TOP 1 1 WHERE  INC_TIC.IDTSOCIETE = '105'  UNION ALL  SELECT top 1  1 FROM
INC_OUVAPTSOCIETE AS OUV1  WHERE OUV1.IDTSOCIETEDON = INC_TIC.IDTSOCIETE  AND OUV1.IDTSOCIETE='105'  AND OUV1.IDTFCTITT = ( CASE  INC_TIC.INDBDDPRD WHEN 'MAR' THEN 501 WHEN 'OCE' THEN 501 ELSE 502 END )  AND OUV1.HST = 0  AND OUV1.BLNRESVIS = 0  UNION ALL  SELECT top 1  1  FROM INC_OUVAPTTYPPRD AS OUV2  WHERE OUV2.IDTSOCIETE = '105'  AND OUV2.IDTTYPPRD= INC_TIC.IDTTYPPRD  AND  INC_TIC.INDBDDPRD IN ('GDR','OCER') AND OUV2.HST = 0  UNION ALL  SELECT top 1  1 FROM INC_OUVAPTEDS AS OUV3 WHERE OUV3.IDTSOCIETE = '105' AND OUV3.IDTENT = INC_TIC.EXT1 AND  INC_TIC.INDBDDPRD IN ('GDR','OCER') AND OUV3.HST = 0  UNION ALL  SELECT  top 1  1 FROM INC_OUVAPTSOURES AS OUV4 WHERE OUV4.IDTSOCIETE = '105' AND OUV4.IDTCTR = INC_TIC.IDTCTR AND  INC_TIC.INDBDDPRD IN ('MAR','OCE') AND OUV4.HST = 0  UNION ALL  SELECT TOP 1 1 FROM OCEA_VIEW_OUVTIC_EDS AS OUVEDS WHERE OUVEDS.IDTTIC = INC_TIC.IDTTIC AND OUVEDS.IDTEDS = 'DCI110'  ) ORDER BY DATTICCREUTC
The performance of this query is poor as described below.
SQL Server Execution Times:
CPU time = 0 ms, elapsed time = 1 ms.
SQL Server parse and compile time:
CPU time = 359 ms, elapsed time = 1538 ms.
SQL Server Execution Times:
CPU time = 0 ms, elapsed time = 1 ms.
SQL Server parse and compile time:
CPU time = 0 ms, elapsed time = 1 ms.
(101 row(s) affected)
Table 'Worktable'. Scan count 0, logical reads 0, physical reads 0, read-ahead reads 0, lob logical reads 0, lob physical reads 0, lob read-ahead reads 0.
Table 'INC_PRD'. Scan count 0, logical reads 290, physical reads 1, read-ahead reads 16, lob logical reads 0, lob physical reads 0, lob read-ahead reads 0.
Table 'INC_TYPPRD'. Scan count 101, logical reads 612, physical reads 3, read-ahead reads 11, lob logical reads 0, lob physical reads 0, lob read-ahead reads 0.
Table 'INC_OUVAPTSOCIETE'. Scan count 101, logical reads 202, physical reads 2, read-ahead reads 0, lob logical reads 0, lob physical reads 0, lob read-ahead reads 0.
Table 'INC_TIC'. Scan count 2, logical reads 112928, physical reads 44, read-ahead reads 7516, lob logical reads 0, lob physical reads 0, lob read-ahead reads 0.
(1 row(s) affected)
SQL Server Execution Times:
CPU time = 891 ms, elapsed time = 1828 ms.
The worst performing part is highlighted in bold. It is clear that logical reads of INC_TIC table are more than 1 Lac (112928).
After analysis of this query we have identified a new index to be created and the index is follows
CREATE INDEX INC_TIC_IDTCLSSYS_DERETATIC_DATTICCREUTC ON INC_TIC
(
IDTCLSSYS,DERETATIC,DATTICCREUTC
)
 WITH FILLFACTOR = 90
 ON INDENCOURS_PSCHEME (INDENCOURS)
 GO
After creating the index performance of same query is as follows
SQL Server Execution Times:
CPU time = 0 ms, elapsed time = 1 ms.
SQL Server parse and compile time:
CPU time = 156 ms, elapsed time = 1284 ms.
SQL Server Execution Times:
CPU time = 0 ms, elapsed time = 1 ms.
SQL Server parse and compile time:
CPU time = 0 ms, elapsed time = 1 ms.
(101 row(s) affected)
Table 'Worktable'. Scan count 0, logical reads 0, physical reads 0, read-ahead reads 0, lob logical reads 0, lob physical reads 0, lob read-ahead reads 0.
Table 'INC_PRD'. Scan count 0, logical reads 395, physical reads 1, read-ahead reads 16, lob logical reads 0, lob physical reads 0, lob read-ahead reads 0.
Table 'INC_TYPPRD'. Scan count 101, logical reads 692, physical reads 3, read-ahead reads 11, lob logical reads 0, lob physical reads 0, lob read-ahead reads 0.
Table 'INC_OUVAPTSOCIETE'. Scan count 101, logical reads 202, physical reads 2, read-ahead reads 0, lob logical reads 0, lob physical reads 0, lob read-ahead reads 0.
Table 'INC_TIC'. Scan count 2, logical reads 2283, physical reads 8, read-ahead reads 1292, lob logical reads 0, lob physical reads 0, lob read-ahead reads 0.
(1 row(s) affected)
SQL Server Execution Times:
CPU time = 266 ms, elapsed time = 562 ms
Now if we compare these two results then performance of this query is improved very much and we can say performance of very good.
The execution plan of query before creating index is described below

and the execution plan of query after creating index is as follows
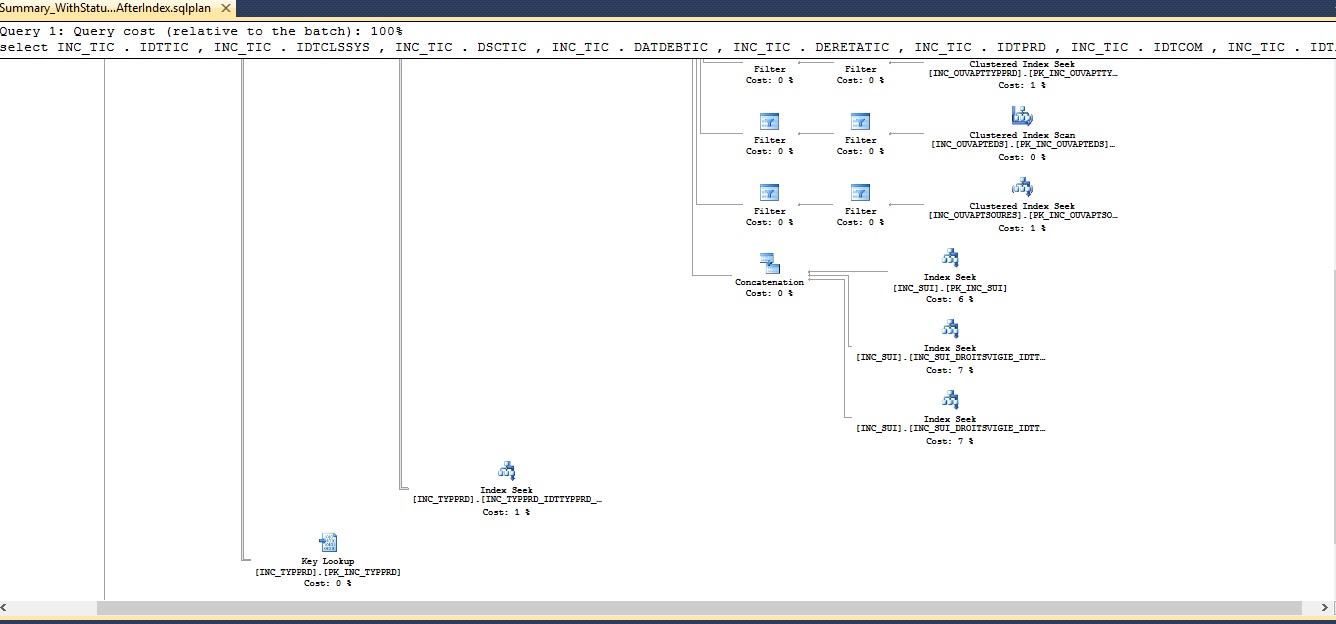
So from above example we have seen the performance of the query was improved a lot by introducing a new index which helped the query execution faster with less usage of resources.
We can do the following things to improve the performance
- Creating / Updating required indexes
- Correcting the order of Joins / WHERE clause so that they can use existing indexes if possible.
- Re-Structuring the query
There may be some another ways possible to improve the performance.
Points of Interest
I have learnt many things while doing this exercise and some of the are illustrated below.
- By doing this we are able to identify the queries which are not performing good in advance stag of SDLC which helps in earlier focus on these queries in order to improve them. Sometimes it is not possible to further improve the performance of a query after an extent because of nature of functional requirement and in this case it will help in communicating this kind of issues to clients in advance (to avoid last moment surprises).
- If someone tries himself to improve a query performance then there are lot of areas of learning and most importantly he/she could learn writing a query in multiple ways and also if a query is found worst performing and an improvement is identified then it can be avoided next time to write same kind of query with bas performance.
- It helps in learning how to write a good query and also effective utilization of creating indexes and applying JOINS which automatically helps in performance improvements of queries.
There are some other interesting points also but it would be great if someone tries this approach and find interesting points by own.
History
- Initial post on 2nd December 2015