
Diagnosing a Windows Service timeout with PerfView
4.80/5 (3 votes)
Today I would like to share with you an interesting (I hope) diagnostics case in one of our system services. The IngestService (that is its name) was not starting properly for the first time – it was being killed because of exceeding the default 30s timeout.
Today I would like to share with you an interesting (I hope) diagnostics case in one of our system services. The IngestService (that is its name) was not starting properly for the first time – it was being killed because of exceeding the default 30s timeout. But the second try was always successful. No exception was thrown and no logs could be found in the event logs. It’s a situation when ETW traces might shed some light on what’s going on. As it was a .NET service I used PerfView to record the trace file. An important checkbox to select when diagnosing thread wait times is the Thread Time box:

After collecting the traces on production, I merged them and copied to my developer machine.
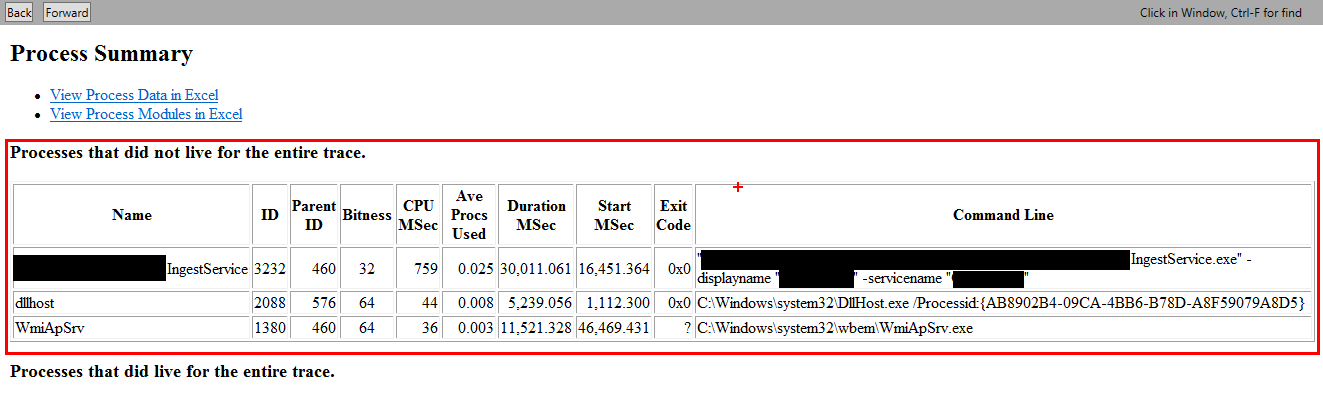
Finding yourself in a trace
The first thing I usually check after opening a trace in PerfView is the TraceInfo and Processes views. The TraceInfo view will show you the original system configuration, while the Processes view lists processes which were active while the trace was collected. If your process was not active during the whole trace session it’s worth to note which processes started or ended during the collection. In our case, next to the investigated IngestService, we have WmiAppSrv and dllhost which started during the session:
Going deeper
Let’s start our analysis by opening the Thread Time Stacks view of our trace:

and selecting the IngestService. For the Thread Time analysis PerfView automatically switches to the CallTree tab and this is probably the best place to start. Now, we need to focus on the goal of our investigation. As you remember the service was not starting properly (its startup time was longer than 30s) so we will be interested in the last activities in the process (especially waits). By checking the time range column we can see that all the threads in the process generated events till the end of its live:

Let’s split the time in half and focus on the second part (we want to know what was the last wait). After expanding the thread nodes we can see that all the threads were BLOCKED (they have some CPU time when the process was killed at the end, but it’s not interesting in our case):

We need to move back and focus on the first half of the session time. And again expand each of the threads and check its last CPU_TIME (the last time it was doing something). It’s hard to compare time ranges when you have a lot of threads and long session time. That’s why, at this point, I usually exclude threads which seem irrelevant and, at the same time, consequently split the time ranges in half, moving from seconds to miliseconds intervals. The final result looks as follows:

Notice we have a BROKEN stack node, but based on the Last and First timestamps and call stacks, we can easily guess which waits are connected. From the screenshot you may see that we are here waiting on some ALPC connection. The full stack looks as follows (I stripped some frames to make the code more compact):
Name
                ...
  |                + MassTransit!ServiceBusFactory.New
  |                 + MassTransit!ServiceBusConfiguratorImpl.CreateServiceBus
  |                  + MassTransit!ServiceBusBuilderImpl.Build
  |                   + MassTransit!ServiceBusBuilderImpl.CreateServiceBus
  |                    + MassTransit!MassTransit.ServiceBus..ctor(class MassTransit.IEndpoint,class MassTransit.IEndpointCache,bool)
  |                     + MassTransit!ServiceBus.InitializePerformanceCounters
  |                      + MassTransit!MassTransit.Monitoring.ServiceBusInstancePerformanceCounters..ctor(class System.String)
  |                       + clr!ThePreStub
                            ...
  |                                + MassTransit!MassTransit.Monitoring.ServiceBusPerformanceCounters..cctor()
  |                                 + MassTransit!MassTransit.Monitoring.ServiceBusPerformanceCounters..ctor()
  |                                  + MassTransit!ServiceBusPerformanceCounters.InitiatizeCategory
  |                                   + System.Core.ni![COLD] System.Linq.Enumerable.Count[System.__Canon](System.Collections.Generic.IEnumerable`1)
  |                                    + System.ni!PerformanceCounterCategory.CounterExists
  |                                     + System.ni!PerformanceCounterCategory.CounterExists
  |                                      + System.ni!PerformanceCounterLib.CounterExists
  |                                       + System.ni!PerformanceCounterLib.CounterExists
  |                                        + System.ni!PerformanceCounterLib.get_CategoryTable
  |                                         + System.ni!PerformanceCounterLib.GetPerformanceData
  |                                          + System.ni!PerformanceMonitor.GetData
  |                                           + mscorlib.ni!RegistryKey.GetValue
  |                                            + mscorlib.ni![COLD] Microsoft.Win32.RegistryKey.InternalGetValue(System.String, System.Object, Boolean, Boolean)
  |                                             + mscorlib.ni!DomainNeutralILStubClass.IL_STUB_PInvoke(Microsoft.Win32.SafeHandles.SafeRegistryHandle, System.String, Int32[], Int32 ByRef, Byte[], Int32 ByRef)
  |                                              + kernel32!RegQueryValueExW
  |                                               + kernel32!LocalBaseRegQueryValue
  |                                                + advapi32!PerfRegQueryValue
  |                                                 + advapi32!QueryExtensibleData
  |                                                  + advapi32!OpenExtObjectLibrary
  |                                                   + WmiApRpl!WmiOpenPerfData
  |                                                   |+ WmiApRpl!WmiAdapterWrapper::Open
  |                                                   | + sechost!OpenServiceW
  |                                                   | + sechost!QueryServiceStatus
  |                                                   |  + sechost!RQueryServiceStatus
  |                                                   |   + rpcrt4!NdrpSendReceive
  |                                                   |    + rpcrt4!NdrSendReceive
  |                                                   |     + rpcrt4!I_RpcSendReceive
  |                                                   |      + rpcrt4!LRPC_CCALL::SendReceive
  |                                                   |       + rpcrt4!LRPC_BASE_CCALL::SendReceive
  |                                                   |        + rpcrt4!LRPC_BASE_CCALL::DoSendReceive
  |                                                   |         + rpcrt4!LRPC_CASSOCIATION::AlpcSendWaitReceivePort
  |                                                   |          + ntdll!ZwAlpcSendWaitReceivePort
  |                                                   |           + ntdll!LdrInitializeThunk
  |                                                   |            + ntdll! ?? ::FNODOBFM::`string'
  |                                                   |             + ntdll!LdrpInitializeProcess
  |                                                   |              + wow64!Wow64LdrpInitialize
  |                                                   |               + wow64!RunCpuSimulation
  |                                                   |                + wow64cpu!ServiceNoTurbo
  |                                                   |                 + wow64!Wow64SystemServiceEx
  |                                                   |                  + wow64!whNtAlpcSendWaitReceivePort
  |                                                   |                   + ntdll!ZwAlpcSendWaitReceivePort
  |                                                   |                    + ntoskrnl!NtAlpcSendWaitReceivePort
  |                                                   |                     + ntoskrnl!AlpcpProcessSynchronousRequest
  |                                                   |                      + ntoskrnl!AlpcpReceiveSynchronousReply
  |                                                   |                       + ntoskrnl!AlpcpSignalAndWait
  |                                                   |                        + ntoskrnl!KeWaitForSingleObject
  |                                                   |                         + ntoskrnl!KiCommitThreadWait
  |                                                   |                          + ntoskrnl!KiSwapContext
  |                                                   |                           + ntoskrnl!SwapContext_PatchXRstor
  |                                                   |                            + BLOCKED_TIME
  |                                                   |                            + CPU_TIME
Finding the cause
So the origin of the wait is in the MassTransit library, in the InitiatizeCategory method of the ServiceBusPerformanceCounters class. Let’s have a look at it:
// MassTransit.Monitoring.ServiceBusPerformanceCounters
private void InitiatizeCategory()
{
	try
	{
		RuntimePerformanceCounter[] source = new RuntimePerformanceCounter[]
		{
			this.ConsumerThreadCount,
			this.ReceiveThreadCount,
			this.ReceiveRate,
			this.PublishRate,
			this.SendRate,
			this.ReceiveCount,
			this.PublishCount,
			this.SentCount,
			this.ConsumerDuration,
			this.ConsumerDurationBase,
			this.ReceiveDuration,
			this.ReceiveDurationBase,
			this.PublishDuration,
			this.PublishDurationBase
		};
		if (!PerformanceCounterCategory.Exists("MassTransit"))
		{
			PerformanceCounterCategory.Create("MassTransit", "MassTransit Performance Counters", PerformanceCounterCategoryType.MultiInstance, new CounterCreationDataCollection((from x in source
			select x).ToArray<CounterCreationData>()));
		}
		else
		{
			int num = (from counter in source
			where !PerformanceCounterCategory.CounterExists(counter.Name, "MassTransit")
			select counter).Count<RuntimePerformanceCounter>();
			if (num > 0)
			{
				PerformanceCounterCategory.Delete("MassTransit");
				PerformanceCounterCategory.Create("MassTransit", "MassTransit Performance Counters", PerformanceCounterCategoryType.MultiInstance, new CounterCreationDataCollection((from x in source
				select x).ToArray<CounterCreationData>()));
			}
		}
	}
	catch (SecurityException)
	{
		string obj = "Unable to create performance counter category (Category: {0})\nTry running the program in the Administrator role to set these up." + ExtensionsToString.FormatWith("\n**Hey, this just means you aren't admin or don't have/want perf counter support**", new object[]
		{
			"MassTransit"
		});
		ServiceBusPerformanceCounters._log.Warn(obj);
	}
}
We can see that it intializes some Performance Counters which are used to monitor the MassTransit client. But still we don’t know why the method took so long. We know however that there was some ALPC connection in the background. Let’s see in the Events view in PerfView if we have any ALPC traces in this time range:

So there was one open client connection coming from our IngestService (which never ended – no RpcClientCall/Stop event could be found with the activity id: 03b984af-47ba-4434-a6df-522edf9c1b42). We can also see that there was an ALPC connection on the server side (activity id: 10b92075-ac49-4423-964d-c944a0f680a0), probably triggered by our client connection, which lasted for 27 seconds! By the time it ended there was no IngestService running. It’s time to analyze what services.exe process was doing in this period of time. Let’s open the Thread Time (with ReadyThread) view, choose services (460) process and set the time range to 18,658.365 – 46,503.131. Then expand the threads and find the ones which were blocked almost all that time. I quickly found a thread 4004 which was trying to start a service, but needed to wait on some critical section. I could also see that this thread was readied by a thread 4904 and then started a new process:

What was the thread 4904 doing at this time:

What was the process name which was started by the 4004 thread? You can sroll up to the beginning of the post, check the start time of the WmiApSrv process and you already know the answer.
Now, everything is clear. Our IngestService, while starting, requested some performance data. To provide this data system needed to start the WMI Performance Adapter (WmiApSrv) service. It seems that at a given moment only one service could be starting (unless it’s a dependent service) and there is a critical section ensuring that. Finally we ended in a classical deadlock situation: the IngestService was waiting for the WmiApSrv to collect some performance data, while WmiApSrv was unable to start because the IngestService was starting.
Solution
After this investigation the solution was simple: we just added WmiApSrv as a dependant service to the IngestService.
PerfView issue
If you are not using US locales on your system it is very probable that selecting date ranges won’t work for you in PerfView. I have Polish locales and needed to modify PerfView binaries in order to set an invariant culture when the application starts (I wrote to Vance Morrison about this issue but haven’t got yet any answer). Contact me if you run into this problem and I will help you.
Filed under: CodeProject, Profiling .NET applications 
![]()