Introduction
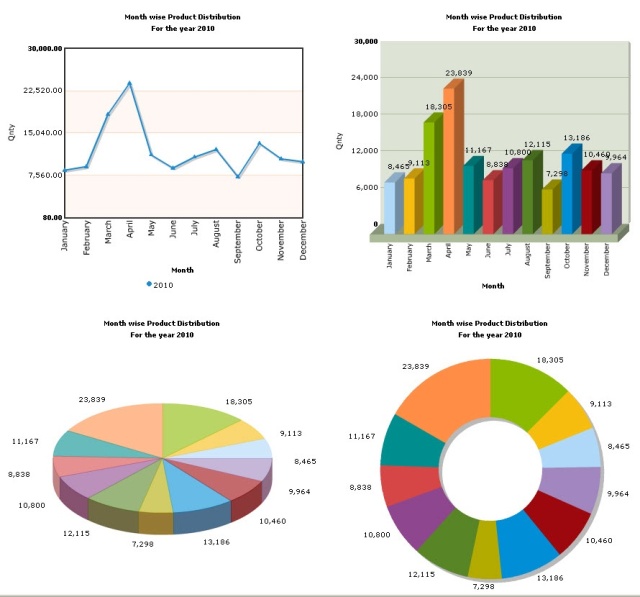
In this article, I would like to show you how to create a stunning Line, Bar, Doughnut, and Pie chart for your ASP.NET application.
Background
I assume you have a basic knowledge of ASP.NET and C#.NET, and so on. FusionCharts Free is an open-source Flash charting component that can be used to render
data-driven and animated charts in your web applications, desktop applications and presentations. It is a cross-browser and cross-platform solution that can be used with PHP,
ASP, ASP.NET, JSP, ColdFusion, Python, RoR, simple HTML pages or even PowerPoint Presentations.
What features does FusionCharts Free support?
FusionCharts Free cover all your basic charting needs with the necessary chart types and features. Some of the highlights are:
- 22 popular charts like Column, Line, Pie, Bar, Area, Stacked, Candlestick and Funnel Charts
- Animated charts that make your applications look “wow”
- Lots of interactive features like tooltips and drill-down
- ASP and PHP APIs have been provided as well for easy implementation
- All the charts can pull data from any database and are AJAX-enabled
What can FusionCharts Free be used for?
The use of FusionCharts Free is bound only by your imagination. It can give a lively face to your boring data pretty much anywhere, and is especially useful in:
- Business Monitoring and Reporting Applications, where charts and graphs are an integral part of the application.
- Digital Dashboards and Executive Information Systems, where charts represents various KPIs.
- Content and Knowledge Management systems, where statistical views are required.
- Network monitoring applications.
- Surveys and Polls.
- Scientific research and experiments, where data is to be visually represented PowerPoint presentations, where you need to visually depict the data
... and anywhere where you need slick charts to represent your data.
You can even RDL FusionCharts Free and distribute with your open or closed source applications free of charge. Take a look at our liberal licensing to know more.
To prepare for a chart using this steps given below.
How to Configure
Step 1:
Download from FusionCharts.
Step 2:
Start a new web-site; give the name as FusionChartGraph. It will give you one
Default.aspx and .cs file.
Step 3:
Download source code and copy the FusionCharts.dll file from the bin directory to some location.
Now add a reference to this FusionCharts.dll file.
Step 4:
Copy FusionCharts folder with all contents in your application folder.
Step 5:
Add src="FusionCharts/FusionCharts.js".
Step 6:
Add a JavaScript function to view the value when user will click on data label.
function myJS(myVar){
    window.alert(myVar);
}
Using the code
Load initial data
DataTable dt = new DataTable("Chart");
private void LoadGraphData()
{
DataColumn dc = new DataColumn("Month", typeof(string ));
DataColumn dc1 = new DataColumn("Qnty", typeof(int ));
dt.Columns.Add(dc);
dt.Columns.Add(dc1);
DataRow dr1 = dt.NewRow();
dr1[0] = "January";
dr1[1] = 8465;
dt.Rows.Add(dr1);
DataRow dr2 = dt.NewRow();
dr2[0] = "February";
dr2[1] = 9113;
dt.Rows.Add(dr2);
DataRow dr3 = dt.NewRow();
dr3[0] = "March";
dr3[1] = 18305;
dt.Rows.Add(dr3);
DataRow dr4 = dt.NewRow();
dr4[0] = "April";
dr4[1] = 23839;
dt.Rows.Add(dr4);
DataRow dr5 = dt.NewRow();
dr5[0] = "May";
dr5[1] = 11167;
dt.Rows.Add(dr5);
DataRow dr6 = dt.NewRow();
dr6[0] = "June";
dr6[1] = 8838;
dt.Rows.Add(dr6);
DataRow dr7 = dt.NewRow();
dr7[0] = "July";
dr7[1] = 10800;
dt.Rows.Add(dr7);
DataRow dr8 = dt.NewRow();
dr8[0] = "August";
dr8[1] = 12115;
dt.Rows.Add(dr8);
DataRow dr9 = dt.NewRow();
dr9[0] = "September";
dr9[1] = 7298;
dt.Rows.Add(dr9);
DataRow dr10 = dt.NewRow();
dr10[0] = "October";
dr10[1] = 13186;
dt.Rows.Add(dr10);
DataRow dr11 = dt.NewRow();
dr11[0] = "November";
dr11[1] = 10460;
dt.Rows.Add(dr11);
DataRow dr12 = dt.NewRow();
dr12[0] = "December";
dr12[1] = 9964;
dt.Rows.Add(dr12);
}
Default visual configuration
string[] color = new string[12];

private void ConfigureColors()
{
    color[0] = "AFD8F8";
    color[1] = "F6BD0F";
    color[2] = "8BBA00";
    color[3] = "FF8E46";
    color[4] = "008E8E";
    color[5] = "D64646";
    color[6] = "8E468E";
    color[7] = "588526";
    color[8] = "B3AA00";
    color[9] = "008ED6";
    color[10] = "9D080D";
    color[11] = "A186BE";
}
Generate 3D pie graph
private void CreatePieGraph()
{
string strCaption = "Month wise Product Distribution";
string strSubCaption = "For the year 2010";
string xAxis = "Month";
string yAxis = "Qnty";
string strXML = null;
strXML = @"<graph caption='" + strCaption + @"' subCaption='" + strSubCaption + @"' decimalPrecision='0'
pieSliceDepth='30' formatNumberScale='0'
xAxisName='" + xAxis + @"' yAxisName='" + yAxis + @"' rotateNames='1'
>";
int i = 0;
foreach (DataRow dr2 in dt.Rows)
{
strXML += "<set name='" + dr2[0].ToString() + "' value='" + dr2[1].ToString() +
"' color='" + color[i] + @"' link="JavaScript:myJS('" +
dr2["Month"].ToString() + ", " + dr2["Qnty"].ToString() + "'); "/>";
i++;
}
strXML += "</graph>";
FCLiteral3.Text = FusionCharts.RenderChartHTML(
"FusionCharts/FCF_Pie3D.swf",
"",
strXML,
"mygraph1",
GraphWidth, GraphHeight,
false
);
}
Generate bar graph
private void CreateBarGraph()
{
string strCaption = "Month wise Product Distribution";
string strSubCaption = "For the year 2010";
string xAxis = "Month";
string yAxis = "Qnty";
string strXML = null;
strXML = @"<graph caption='" + strCaption + @"' subCaption='" + strSubCaption + @"' decimalPrecision='0'
pieSliceDepth='30' formatNumberScale='0'
xAxisName='" + xAxis + @"' yAxisName='" + yAxis + @"' rotateNames='1'
>";
int i = 0;
foreach (DataRow dr2 in dt.Rows)
{
strXML += "<set name='" + dr2[0].ToString() + "' value='" + dr2[1].ToString() +
"' color='" + color[i] + @"' link="JavaScript:myJS('" +
dr2["Month"].ToString() + ", " + dr2["Qnty"].ToString() + "'); "/>";
i++;
}
strXML += "</graph>";
FCLiteral2.Text = FusionCharts.RenderChartHTML(
"FusionCharts/FCF_Column3D.swf",
"",
strXML,
"mygraph1",
GraphWidth, GraphHeight,
false
);
}
Generate line graph
private void CreateLineGraph()
{
string strCaption = "Month wise Product Distribution";
string strSubCaption = "For the year 2010";
string xAxis = "Month";
string yAxis = "Qnty";
string strXML = null;
strXML = @"
<graph caption='" + strCaption + @"'
subcaption='" + strSubCaption + @"'
hovercapbg='FFECAA' hovercapborder='F47E00' formatNumberScale='0' decimalPrecision='2'
showvalues='0' numdivlines='3' numVdivlines='0' yaxisminvalue='80.00' yaxismaxvalue='80.00'
rotateNames='1'
showAlternateHGridColor='1' AlternateHGridColor='ff5904' divLineColor='ff5904'
divLineAlpha='20' alternateHGridAlpha='5'
xAxisName='" + xAxis + @"' yAxisName='" + yAxis + @"'
>
";
string tmp = null;
tmp = @"<categories font='Arial' fontSize='11' fontColor='000000'>";
foreach (DataRow dr2 in dt.Rows)
{
tmp += @"<category name='" + dr2["Month"].ToString().Trim() + @"' />";
}
tmp += @"</categories>";
strXML += tmp;
tmp = @"<dataset seriesName='2010' color='1D8BD1' anchorBorderColor='1D8BD1' anchorBgColor='1D8BD1'>";
foreach (DataRow dr2 in dt.Rows)
{
tmp += @"<set value='" + dr2["Qnty"].ToString().Trim() +
@"' link="JavaScript:myJS('" + dr2["Month"].ToString() +
", " + dr2["Qnty"].ToString() + "'); " />";
}
tmp += @"</dataset>";
strXML += tmp;
strXML += "</graph>";
FCLiteral1.Text = FusionCharts.RenderChartHTML(
"FusionCharts/FCF_MSLine.swf",
"",
strXML,
"mygraph4",
GraphWidth, GraphHeight,
false
);
}
Generate doughnut graph
private void CreateDoughnutGraph()
{
string strCaption = "Month wise Product Distribution";
string strSubCaption = "For the year 2010";
string xAxis = "Month";
string yAxis = "Qnty";
string strXML = null;
strXML = @"<graph caption='" + strCaption + @"' subCaption='" + strSubCaption + @"' decimalPrecision='0'
pieSliceDepth='30' formatNumberScale='0'
xAxisName='" + xAxis + @"' yAxisName='" + yAxis + @"' rotateNames='1'
>";
int i = 0;
foreach (DataRow dr2 in dt.Rows)
{
strXML += "<set name='" + dr2[0].ToString() + "' value='" + dr2[1].ToString() +
"' color='" + color[i] + @"' link="JavaScript:myJS('" +
dr2["Month"].ToString() + ", " + dr2["Qnty"].ToString() + "'); "/>";
i++;
}
strXML += "</graph>";
FCLiteral4.Text = FusionCharts.RenderChartHTML(
"FusionCharts/FCF_Doughnut2D.swf",
"",
strXML,
"mygraph1",
GraphWidth, GraphHeight,
false
);
}
References
Conclusion
FusionCharts Free is an open-source free Flash charting component that can be used to render data-driven animated charts.
Made in Macromedia Flash MX, FusionCharts can be used with any web scripting language like PHP, ASP, .NET, JSP, ColdFusion, JavaScript,
Ruby on Rails etc., to deliver interactive and powerful charts. Using XML as its data interface,
FusionCharts makes full use of fluid beauty of Flash to create compact, interactive and visually-arresting charts.
Conclusion
I will show some more graph examples like Candlestick, Gantt, etc., in my upcoming tutorial.
History
None so far.
More than 8 years experience on Programming and Project implementation, I was primarily involved with projects for private organization,Govt.(Bangladesh Army,DG Health,RJSC), NGO (SEDF,WFP). Presently I am working at ICDDR,B and enhancing Hospital Management System developed by Microsoft Dynamic NAV and Windows Mobile Application 5.0
An active supporter of Open Source technology, my interested areas are ERP, IT Audit, Data warehouse, BI etc.
Playing Guitar for 15 years, my interested music style is Blues Rock,Neo Classical.
Certification
70-540:Microsoft® Windows Mobile® 5.0 - Application Development
MB7-514:Microsoft Dynamics™ NAV 5.0 C/SIDE Introduction
MB7-516:Microsoft Dynamics™ NAV 5.0 Solution Development
MB7-517:Microsoft Dynamics™ NAV 5.0 Installation and Configuration
MB7-515:Microsoft Dynamics™ NAV 5.0 Financials
70-432:Microsoft SQL Server 2008 - Implementation and Maintenance
70-450:PRO: Designing, Optimizing and Maintaining a Database Administrative Solution Using Microsoft SQL Server 2008
70-448:Microsoft SQL Server 2008, Business Intelligence Development and Maintenance
312-50:Certified Ethical Hacker
Web :http://masudparvezshabuz.appspot.com
Blog :http://masudparvezshabuz.wordpress.com
linkedin :http://www.linkedin.com/in/masudparvez


 General
  News
News  Suggestion
  Question
  Bug
Bug  Answer
  Joke
Joke  Praise
  Rant
Rant  Admin
Admin 


