Introduction
This is part three of a three part series of articles on creating and debugging Arduino programs in Visual Studio Code.
Why Would I Want to Do This?
With the default configuration of the debugger described in part 2, the debugged program runs much slower than normal. This is because the debugger must compare the current location of the executed program with table of breakpoint locations to know when to stop the program. In many cases, this slowing down is not a problem, but sometimes it is.
If you need the program to run at normal speed before it stops at a breakpoint (for example, to generate some signal) you need to configure the debugger library to use flash breakpoints. With flash breakpoints, the location in your program where you insert a breakpoint is replaced by jump to the debugger, so the program runs at normal speed until it hits the breakpoint and stops. But using flash breakpoints requires being able to write to the flash memory which is only possible if you use special bootloader.
So that’s why you need to replace the bootloader in your Arduino. For now, the special bootloader is only available for Atmega328, so flash breakpoints can be used only with Arduino boards based on Atmega328 – that is Uno and Nano (both tested and working) and some other variants (which I didn’t test). Sorry, it’s not available for Arduino Mega, so you can only debug Mega with the RAM breakpoints.
Background
The tutorial below is intended for those who do not have AVR ISP programmer. It shows how to replace the bootloader in your Arduino Uno using another Arduino Uno as a programmer.
If you have an ISP programmer AND want to use the programmer with Arduino IDE, you can still use this tutorial. If you use another software with your programmer (like Atmel Studio), you probably don’t need this tutorial; you can just burn the new bootloader to your Arduino using this ISP programmer. You can find the bootloader in arduino/library/avr-debugger/bootloader folder in the avr-debugger project and instructions for setting the fuses in the readme.txt.
Tools Needed
- Arduino Uno – 2 pieces (or other Arduino which can be used as ISP programmer)
- Arduino IDE
- Avr-debugger library - can be download from Part 2 of this article
- Hardware platform for Arduino – can be downloaded from this article
Step 1: Add New Hardware Configuration to Your Arduino Installation
Why? Hardware configuration is needed to be able to burn custom bootloader (our debugger-enabled bootloader) to your Arduino board from the Arduino IDE.
- Download the zip file attached to this article.
- Copy the folder hardware from the zip archive to your Arduino sketchbook folder.
By default, this is [your user folder]/Documents/Arduino. You can find the location in Arduino IDE > Preferences. If you already have the hardware folder there, just copy the avr-debugger subfolder into this folder. - Restart Arduino IDE if it was running at this point.
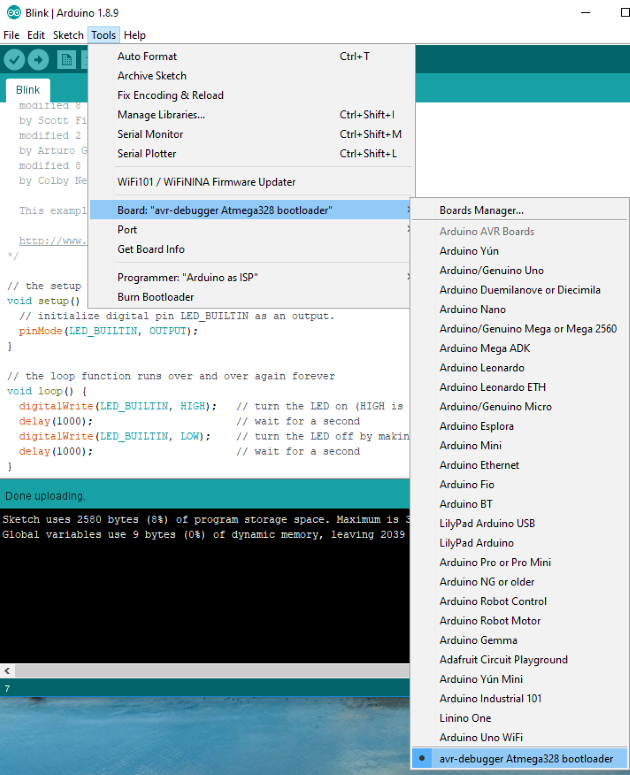
- Check the menu Tools > Board. There should be a new item called avr-debugger Atmega328 bootloader.
Step 2: Prepare the Arduino to be used as ISP Programmer
Why? You need to use a programmer to replace the bootloader in your Arduino. You can buy an external programmer to do this but you can also use another Arduino board as a programmer. This tutorial assumes you use Arduino Uno as a programmer, but it is possible to use another board too. Just search the internet for info on how to connect it.
- Connect the Arduino Uno to be used as a programmer to your computer.
- Start Arduino IDE and open Arduino ISP example program by going to File > Examples > Arduino ISP.
- Select the board – Arduino/Genuino Uno in the Tools menu in Arduino IDE.
- Select the correct port where the Arduino is connected, for example, COM6.
- Click the Upload button and upload the Arduino ISP program to the Arduino.
This program will turn the Arduino into an ISP programmer.
Step 3: Connect the Target Arduino and the Programmer Arduino
- Disconnect the programmer Arduino from your computer – unplug the USB cable.
- Use the connection diagram shown below to connect the target Arduino. The image is taken from this article on Arduino.cc where you can also find more info about using Arduino as ISP programmer.

Image source: https://www.arduino.cc/en/Tutorial/ArduinoISP
Step 4: Burn the New bootloader to Target Arduino
- Connect the programmer Arduino to your computer. Don’t connect the target Arduino to your computer; it will be powered from the programmer Arduino.
- Start Arduino IDE if not already running.
- In Tools menu, select board avr-debugger Atmega328 bootloader.
- In Tools > Port, select the port of your programmer Arduino, e.g., COM6.
- In Tools > Programmer select Arduino as ISP.
- Click Tools > Burn bootloader.
The IDE should show a message “Burning bootloader” in the status bar and after some time “done”.
Step 5: Verify that the bootloader is Working
- Disconnect the USB cable from the programmer Arduino.
- Disconnect the wires from the target Arduino (the one which now has new bootloader).
- Connect the target Arduino to your computer with the USB cable.
- In Arduino IDE, select the port in Tools > Port. This will be a different port than in previous steps, for example, COM4.
- Open the Blink example and upload it to the board.
If all worked well, the LED on your Arduino should now blink. Uploading the programs from Arduino IDE should work as usual – the new bootloader and the old (original) one behave the same in this situation.
One note: Maximum size of your program with the new bootloader is 30720 bytes, about 1.5 kB less than with the original bootloader. This is because the new bootloader is bigger than the original one. You will probably not reach this limit but if you want the Arduino IDE to watch the size of your programs for you, you can keep the board “avr-debugger Atmega328 bootloader” selected in the Tools > Board menu instead of the standard Arduino/Genuino Uno.
Step 6: Debug Your Program With Flash Breakpoints Enabled
In this step, I assume you have a project (folder) configured in Visual Studio Code to develop and debug Arduino program. If not, please see the article with step 2.
- In some file manager (like Total Commander or Windows Explorer), locate the file avr8-stub.h in the
avr-debugger library – it is in [your user folder]\Documents\Arduino\libraries\avr-debugger\src.
Open this file in any text editor – you can use VS Code or just Notepad.
Locate the line:
#define AVR8_BREAKPOINT_MODE (1)
And change the 1 to 0 (zero), so the line will be:
#define AVR8_BREAKPOINT_MODE (0)
This tells the avr-debugger library to use flash breakpoints instead of the RAM breakpoints.
- Build (verify) your program in VS Code. I suggest that you use simple blink program for this. The size of the program should be about 700 bytes larger now with the flash breakpoints enabled than with the RAM breakpoints. In my case, the program uses about 8600 bytes of program space.
- Upload the program to your Arduino. Unless you placed a breakpoint in the code, the LED should now blink.
- Click on the debug button on the left-hand side of VS Code and then on the Start debugging button in the top of the debug view (it looks like a green Play button).
After some time, the debugger should connect to the program – the status bar at the bottom of VS Code will turn orange.
- Click the Pause button in the debugger toolbar which appears at the top. You should find yourself in the Arduino core code, probably in the
delay() function. You can use the Step Out button to get to your code in the loop function.
Now you can step through the code and so on as usual.
How Can I Tell if I Am Using Flash Breakpoints?
If you let the program run at full speed – click the Continue (F5) button (and there are no breakpoints), the LED should blink at the correct speed. For example, if you use delay(1000) between digitalWrite with HIGH and LOW, the LED should be on for 1 second. If this is true, you are using flash breakpoints. If, on the other hand, the LED is on for a longer time (maybe about 5 seconds), this means you are using RAM breakpoints.
Important Note on Flash Wear
The program (flash) memory in the AVR microcontroller used in Arduino can survive about 10 thousand rewrites. Normally, it is rewritten once when you upload a new program to your Arduino. So in theory, you can upload 10 thousand times and then your Arduino may fail. In practice, the number of possible rewrites is much higher, but still it is not unlimited.
When using the debugger with flash breakpoints, the memory is overwritten much more often. When a breakpoint is inserted or removed, part of the memory needs to be rewritten. Breakpoints are inserted and removed not only when you actually insert/remove a breakpoint in the IDE but also automatically when you continue from a breakpoint (the original instruction needs to be restored and executed) and also sometimes when you step through the code, the debugger will insert temporary breakpoint, for example to stop the program after stepping over a function.
In general, you can expect one write to flash memory for each step/continue click you do in the IDE. This seems scary but it is not that bad and your Arduino will survive long enough. It’s just good to know about this and try to follow these recommendations to minimize the memory wear:
- Use only as many breakpoints as really needed. Often, you will only need one breakpoint at a time. The debugger must always update all the breakpoints when the program is run, not just the one which will be hit next – the debugger does not know which one will be hit next.
- When you no longer need a breakpoint, remove it. This is not to say that you should remove and re-insert a breakpoint each time the program stops on it, but when you know that you will be dealing with other part of the program and the breakpoint will not be needed for some time, remove it. It only takes one write to remove a breakpoint upon your command while this same breakpoint would be unnecessarily removed and inserted automatically every time you let the program run.
- Remove the breakpoint automatically inserted by VS Code to main. This is a strange feature in VS Code that it always inserts breakpoint into the main function and I haven’t found a way to disable this. So after you start debugging, pause the program and in the Debug console view at the bottom of VS Code, enter this command:
-exec clear main
Points of Interest
Point 1
In the boards.txt file which defines the hardware platform for burning the debugger from Arduino IDE, the lock bits are set to 0x2F. This value allows reading the bootloader memory from the application (your) program. This is needed for the flash breakpoints debugging to work. The default value used for Arduino Uno is 0xCF which means both reading and writing in the bootloader section is prohibited.
Point 2
If you want to see how many times the flash memory is rewritten during your debug session, do this:
Open app_api.c file in the avr-debugger library in src subfolder.
Uncomment this line:
#define AVR8_API_DEBUG
Rebuild and upload your program.
In VS Code when debugging, add the following expression in the Expressions window: g_boot_write_cnt
This variable shows how many times flash memory was written. It counts the total number of writes in any location of the memory, not the writes into a particular page of the memory so the actual memory wear may be lower.
Point 3
In some of the steps described above, we modified the avr-debugger library options by editing the header files in libraries/avr-debugger/src. The problem is that each such change affects all the programs which use this library. For example, if you enable flash breakpoints, you do it for all your programs which use the avr-debugger library.
This is a feature of the Arduino environment that it doesn’t support passing any configuration values (preprocessor defines) to a library. One way to overcome this would be to copy the library files to your VS Code folder. This way, you would have a separate copy of the avr-debug library for each program with any settings valid only for this project. To do this, don’t insert the library into your programs, just copy all the files from avr-debugger/src to your program folder. But note that I haven't tested this option yet.
History
- 2019-09-11: Updated zip file with new bootloader
- 2019-07-16: First version published
Works at Tomas Bata University in Zlin, Czech Republic. Teaches embedded systems programming. Interested in programming in general and especially in programming microcontrollers.


 General
  News
News  Suggestion
  Question
  Bug
Bug  Answer
  Joke
Joke  Praise
  Rant
Rant  Admin
Admin 


 ).
).