Click here to Skip to main content
15,888,263 members
Articles / Programming Languages / Visual Basic
Tip/Trick

VB.NET Calculating Linear Regression Slope and Intercept

Rate me:
Please Sign up or sign in to vote.
3.90/5 (3 votes)
25 Jan 2022CPOL2 min read 8.7K   217   7   1
Mimic Excel Slope and Intercept functions for datasets
This example shows you how to use VB.NET to mimic the Excel Slope (known_ys, known_xs) and Intercept (known_ys, known_xs) functions in code. It has a simplified snippet of code that has the bare basics, then a more robust version which contains the DataGridView form.

Introduction

When it is needed to programatically calculate Linear Regression Slope and Intercept statistical values, you need to do it manually since VB.NET doesn't have many math features built in.

Program form

Image 1

Background

I went looking for how to calculate linear regression slope and intercept in a program I am writing and since I have many years between me and math formulas, it was a bit of a challenge. I looked around for an example that would break down the problem into chunks for me to understand and implement into code but didn't find much.

Using the Code

Here is the basic function. The resultant variables, m and c, will contain the slope and the intercept.

To use code this as it is here:

  1. Create a new "Windows Forms App (.NET Framework)" Visual Basic project in Visual Studio.
  2. Add one text box to the form.
  3. Set the text box to Multiline by clicking the ">" in the upper right corner and checking Multiline.
  4. Make the text box bigger by dragging its edges.
  5. Double click the title bar of the form to open the "FormX_load" function.
  6. Paste this in and run it.
VB
'This is the snippet of code as shown on the codeproject page:

'Citation: Help in understanding this formula https://www.easycalculation.com/statistics/learn-regression.php
'This programatically mimics the behavior of the "Slope() and Intercept()" functions in MS Excel
'This was written by Logicisme - Codeproject.org


'Define the variables to be used:
Dim X As New List(Of Double) 'X = First Data Set
Dim Y As New List(Of Double) 'Y = Second Data Set
Dim c As Double   'The intercept point of the regression line and the y axis.
Dim N As Integer   'Number of values or elements
Dim ΣXY As Double 'Sum of the Product of First and Second Data Set
Dim m As Double   'The slope of the regression line
Dim ΣX As Double 'Sum of all of the X values
Dim ΣY As Double 'Sum of all of the Y values
Dim ΣX2 As Double 'ΣX2 = Sum of Square of X Data Set Values

'Note, there is nothing special about the variables with the Σ in it. It just more closely represents the actual formula.

'Manually adding the sample data into the two lists.
X.Add(60)
X.Add(61)
X.Add(62)
X.Add(63)
X.Add(65)

Y.Add(3.1)
Y.Add(3.6)
Y.Add(3.8)
Y.Add(4)
Y.Add(4.1)

'Assign initial values into our variables.
N = X.Count  'Adding the total number of rows of data. It really doesn't matter where this comes from so long as it matches the dataset count.
ΣX = X.Sum 'Uses list function to add up its values
ΣY = Y.Sum 'Uses list function to add up its values
ΣXY = 0 'Assigning a value before first use
ΣX2 = 0 'Assigning a value before first use

'Calculate  ΣXY sum of the product of each row of x,y
' This For loop again subtracts 1 from N since N represents the count from 1 and not 0 which we need
' "+=" adds a value into the variable it is referencing.
For i = 0 To N - 1
    ΣXY += X(i) * Y(i)
Next

'Calculate ΣX2 sum of the square of each x. This works the same way as the last loop.
For i = 0 To N - 1
    ΣX2 += X(i) ^ 2
Next

'Calculate the slope. Use the cited reference for an explanation of the math
m = ((N * ΣXY) - (ΣX * ΣY)) / ((N * ΣX2) - (ΣX ^ 2))

'Calculate the intercept. Use the cited reference for an explanation of the math
c = (ΣY - m * ΣX) / N


'Puts the result text in our text box. "&=" allows you to add to the end of a text string. "vbcrlf" adds a line return
TextBox1.Text &= "Sum of X: ΣX=" & ΣX & vbCrLf
TextBox1.Text &= "Sum of Y: ΣY=" & ΣY & vbCrLf
TextBox1.Text &= "Sum of the product of each row: ΣXY=" & ΣXY & vbCrLf
TextBox1.Text &= "Rows of data n=" & N & vbCrLf
TextBox1.Text &= "Sum of each X value squared: ΣX2=" & ΣX2 & vbCrLf

TextBox1.Text &= "Slope: m=" & m & vbCrLf
TextBox1.Text &= "Intercept: c=" & c & vbCrLf

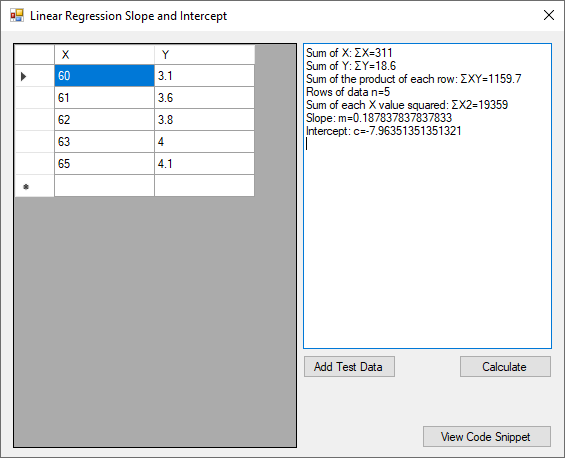
The code sample in the zip contains a working program which uses a DataGridView to populate the values. It also contains a second form with this exact snippet of code.

Here is what this snippet should look like when done:

Image 2

Here is what the code of the snippet looks like in Visual Studio:

Image 3

Points of Interest

I used this site to get a working model of this formula going.

You will see the same dataset represented in my downloadable code so you can test the results.

I also included an Excel spreadsheet with the formulas and same data.

History

  • 24th January, 2022: Initial version
  • 24th January, 2022: Applying editor suggestions

License

This article, along with any associated source code and files, is licensed under The Code Project Open License (CPOL)


Written By
Unknown
This member has not yet provided a Biography. Assume it's interesting and varied, and probably something to do with programming.

Comments and Discussions

 
QuestionNumerically robust? Pin
Fly Gheorghe25-Jan-22 7:42
Fly Gheorghe25-Jan-22 7:42 
Simply applying a theoretical formula will most likely fail in case data includes very large and/or very small values.
The following code is a more robust C++ implementation from a very old project (20 years back) but fully correct, that computes a and b from Y = a*X + b, returning the correlation coefficient. The code is obvious and can be easily ported to VB. Indexing is from 0. The values T.point[i].x and T.point[i].y are the coordinates of the series.

It would be interesting to check if the VB internal methods used in your posting are robust (I assume they are).
Unfortunately I cannot give a quick an example of a test data set for this.

double ComputeCrossCorrelation (T &my_cc, int length, double &a_coef, double &b_coef)
{
double sum_sq_x = 0.0;
double sum_sq_y = 0.0;
double sum_coproduct = 0.0;
double sweep = 0.0;
double pop_sd_x = 0.0;
double pop_sd_y = 0.0;
double cov_x_y = 0.0;
double correlation = 0.0;
double N = length;
double mean_x = 0.0;
double mean_y = 0.0;
double delta_x = 0.0;
double delta_y = 0.0;

a_coef = b_coef = 0.0;

if (length <= 0)
return 0.0;

try
{
if (length == 1)
{
if (my_cc.point[0].x != 0.0)
a_coef = my_cc.point[0].y / my_cc.point[0].x;
if (IsNan(a_coef))
throw -1;

return 1.0;
}

// Correlation coefficient
mean_x = my_cc.point[0].x;
mean_y = my_cc.point[0].y;
for (int i = 2; i <= N; i++)
{
sweep = ((double)i - 1.0) / (double)i;
delta_x = my_cc.point[i - 1].x - mean_x;
delta_y = my_cc.point[i - 1].y - mean_y;
sum_sq_x += delta_x * delta_x * sweep;
sum_sq_y += delta_y * delta_y * sweep;
sum_coproduct += delta_x * delta_y * sweep;
mean_x += delta_x / (double)i;
mean_y += delta_y / (double)i;
}
pop_sd_x = sqrt( sum_sq_x / N );
pop_sd_y = sqrt( sum_sq_y / N );
cov_x_y = sum_coproduct / N;
if ((pop_sd_x * pop_sd_y) == 0 || sum_sq_x == 0)
throw -1;
correlation = cov_x_y / (pop_sd_x * pop_sd_y);
if (IsNan(correlation))
throw -1;
//Regression line
a_coef = sum_coproduct/ sum_sq_x;
if (IsNan(a_coef))
throw -1;
b_coef = mean_y - a_coef * mean_x;
return correlation;
}
catch(...)
{
a_coef = b_coef = 0;
return 0.0;
}
}

General General    News News    Suggestion Suggestion    Question Question    Bug Bug    Answer Answer    Joke Joke    Praise Praise    Rant Rant    Admin Admin   

Use Ctrl+Left/Right to switch messages, Ctrl+Up/Down to switch threads, Ctrl+Shift+Left/Right to switch pages.