In this article, I’d like to show you how to create a basic Gantt chart app step by step with the help of two components: Vue.js and dhtmlxGantt.
Introduction
Gantt charts have recently gained in popularity as an efficient project management tool in diverse industries like construction, logistics, finance, healthcare, and many others. There are a lot of ready-to-use solutions offered by software vendors in the market now. However, it’s not so complicated to build your own Gantt chart app for your purposes. In this article, I’d like to show you how to create a basic Gantt app step by step with the help of two components: Vue.js and dhtmlxGantt.
Background
Vue.js is an open-source progressive JavaScript framework for building user interfaces and single-page apps. One of its main advantages is a very small size of the framework. It has a simple structure and thus is easy to use even for beginning developers. Additionally, Vue.js makes possible real-time updates of your apps due to the reactive two-way data binding. You can get acquainted with some examples of Vue components here.
dhtmlxGantt is an open-source JS Gantt chart, which can be used to create simple web apps and extend them with many additional features like backward planning, export to PDF, PNG, Excel or MS Project, inline editing, keyboard navigation, and many others. All features can be found here or on the GitHub repository.
Prerequisites
Make sure you have the latest stable versions of Node.js and Vue.js installed on your computer. You can verify what is your Node.js version by entering the command node -v in your terminal. For our purposes, we’ll need at least v8.12. You can download the latest Node.js version from their website. If you don’t have Vue.js on your PC, consult this article.
Before we get down to creating our app, we should also install the Vue command-line interface (Vue CLI). It can be installed in two ways:
//Via NPM:
npm install -g @vue/cli

//Or Yarn:
yarn global upgrade --latest @vue/cli
yarn global add @vue/cli
Creating the Gantt Chart
Now let’s start with creating a project for our Gantt chart app. Enter the following command in your terminal:
vue create gantt-vue
You’ll be asked to pick a preset (babel or eslint) and the package manager to use in order to install dependencies (Yarn or NPM). By pressing the enter button for each question, you can choose the default options.
If the project is created successfully, you’ll see a screen like that in a few seconds:
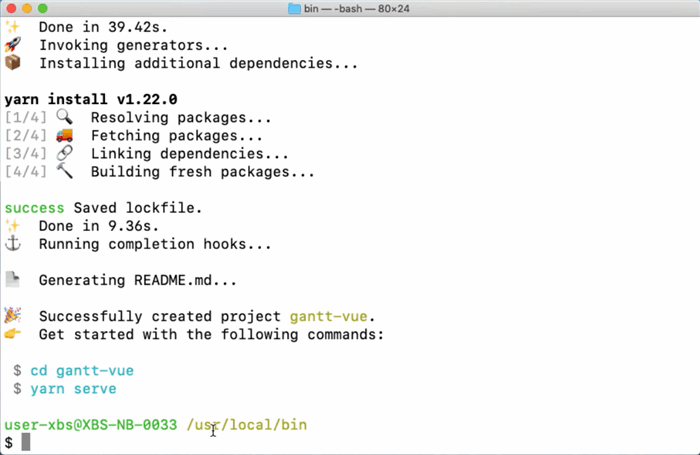
Now let’s run our app locally. Choose your working directory:
cd gantt-vue
And install dependencies (here I use yarn):
yarn install

yarn serve
If you use npm, you need to call the following commands:
npm install

npm run dev
Good job! The app is running on http://localhost:8080

Adding dhtmlxGantt to Your Project
At this point, we’re going to add dhtmlxGantt into our app. First, we need to stop the app by pressing Ctrl+C in the command line. Next, run the following command:
yarn add dhtmlx-gantt --save (for yarn)

npm install dhtmlx-gantt --save (for npm)
Then we’ll go to the app directory and create a folder with Gantt file there (src/components/Gantt.vue):
In the newly created Gantt.vue file, we’ll add the following lines of code:
{{ src/components/Gantt.vue }}
<template>
  <div ref="gantt"></div>
</template>

<script>
import {gantt} from 'dhtmlx-gantt';
export default {
  name: 'gantt',
  props: {
    tasks: {
      type: Object,
      default () {
        return {data: [], links: []}
      }
    }
  },


  mounted: function () {
    gantt.config.xml_date = "%Y-%m-%d";
    gantt.init(this.$refs.gantt);
    gantt.parse(this.$props.tasks);
  }
}
</script>

<style>
    @import "~dhtmlx-gantt/codebase/dhtmlxgantt.css";
</style>
Great! The Gantt chart component is ready now. When the element will be added to the page, it will initialize the Gantt chart under the “gantt” ref. Then, the Gantt chart will load data from the tasks property.
Right now, we need to add our Gantt chart into our Vue.js app. Open the App.vue file and replace the code there with the following lines:
{{ src/App.vue }}

<template>
  <div class="container">
    <gantt class="left-container" :tasks="tasks"></gantt>
  </div>
</template>

<script>
import Gantt from './components/Gantt.vue';

export default {
  name: 'app',
  components: {Gantt},
  data () {
    return {
      tasks: {
        data: [
          {id: 1, text: 'Task #1', start_date: '2020-01-17', duration: 3, progress: 0.6},
          {id: 2, text: 'Task #2', start_date: '2020-01-20', duration: 3, progress: 0.4}
        ],
        links: [
          {id: 1, source: 1, target: 2, type: '0'}
        ]
      },
    }
  }
}
</script>


<style>
  html, body {
    height: 100%;
    margin: 0;
    padding: 0;
  }

  .container {
    height: 100%;
    width: 100%;
  }

  .left-container {
    overflow: hidden;
    position: relative;
    height: 100%;
  }
</style>
Run yarn serve to reload the page. Here is our Gantt chart with predefined tasks:
Real-Time Changes
All real-life apps have to track user actions and react to the changes made by end-users. Let’s try to implement this functionality by the example of a simple changelog. We’ll create a neat list where we’re going to write all the changes made to our Gantt chart.
Let’s get back to the file of our Gantt chart component. Here, we need to add the code that will trace and emit changes made to dhtmlxGantt.
Firstly, we need to create a DataProcessor instance with a custom router object, where the router is a function, and call the $emit method to pass DataProcessor events to the parent component.
Let’s find the gantt.init method and add the following lines of code right after it:
gantt.createDataProcessor((entity, action, data, id) => {
      this.$emit(`${entity}-updated`, id, action, data);
   });
Thus, we attach handlers to the events of DHTMLX Gantt for adding, deleting and updating Gantt links and tasks. When a handler is called, a Vue.js event will be triggered with appropriate parameters.
Secondly, we have to add these event listeners into the App.vue file and prepare a new div container, where we’ll display a log of user actions.
So let’s add the following code into the App.vue file:
{{ src/App.vue }}
<script>
import Gantt from './components/Gantt.vue';

export default {
  name: 'app',
  components: {Gantt},
  data () {
    return {
      tasks: {
        data: [
          {id: 1, text: 'Task #1', start_date: '2020-01-17', duration: 3, progress: 0.6},
          {id: 2, text: 'Task #2', start_date: '2020-01-20', duration: 3, progress: 0.4}
        ],
        links: [
          {id: 1, source: 1, target: 2, type: '0'}
        ]
      },
      messages: []
    }
  },
  methods: {
    addMessage (message) {
      this.messages.unshift(message)
      if (this.messages.length > 40) {
        this.messages.pop()
      }
    },

    logTaskUpdate (id, mode, task) {
      let text = (task && task.text ? ` (${task.text})`: '')
      let message = `Task ${mode}: ${id} ${text}`
      this.addMessage(message)
    },

    logLinkUpdate (id, mode, link) {
      let message = `Link ${mode}: ${id}`
      if (link) {
        message += ` ( source: ${link.source}, target: ${link.target} )`
      }
      this.addMessage(message)
    }
  }
}
</script>

<style>
  html, body {
    height: 100%;
    margin: 0;
    padding: 0;
  }
  .container {
    height: 100%;
    width: 100%;
  }
  .left-container {
    overflow: hidden;
    position: relative;
    height: 100%;
  }
  .right-container {
    border-right: 1px solid #cecece;
    float: right;
    height: 100%;
    width: 340px;
    box-shadow: 0 0 5px 2px #aaa;
    position: relative;
    z-index:2;
  }
  .gantt-messages {
    list-style-type: none;
    height: 50%;
    margin: 0;
    overflow-x: hidden;
    overflow-y: auto;
    padding-left: 5px;
  }
  .gantt-messages > .gantt-message {
    background-color: #f4f4f4;
    box-shadow:inset 5px 0 #d69000;
    font-family: Geneva, Arial, Helvetica, sans-serif;
    font-size: 14px;
    margin: 5px 0;
    padding: 8px 0 8px 10px;
  }
</style>
With the help of this code, we define where we’re going to store log entries via the messages property. We also specify new methods for showing the latest messages on top of our changelog and creating log messages for actions performed with tasks (logTaskUpdate) and links (logLinkUpdate) and adding them to the message stack (addMessage). Besides, here we set the styles for our changelog.
The last thing we need to do is to specify the template of the app to show the Gantt chart with the updated tasks and links on the left and the changelog on the right:
{{ src/App.vue }}

<template>
  <div class="container">
    <div class="right-container">
      <ul class="gantt-messages">
        <li class="gantt-message" v-for="(message, index) in messages"
            v-bind:key="index">{{message}}</li>
      </ul>
    </div>
    <gantt class="left-container" :tasks="tasks" @task-updated="logTaskUpdate"
           @link-updated="logLinkUpdate"></gantt>
  </div>
</template>
Now it’s time to check if everything works as expected. Try moving Task 1 along the Timeline. As a result, the changelog will show the following message:
Let’s add the following lines of code right after the gantt.createDataProcessor in the Gantt.vue file:
{{ src/components/Gantt.vue }}

gantt.attachEvent('onTaskSelected', (id) => {
      let task = gantt.getTask(id);
      this.$emit('task-selected', task);
});

    gantt.attachEvent('onTaskIdChange', (id, new_id) => {
       if (gantt.getSelectedId() == new_id) {
         let task = gantt.getTask(new_id);
         this.$emit('task-selected', task);
        }
     });
When a user selects a task, we can capture the API events of DHTMLX Gantt because the ‘onTaskSelected‘ event fires and then we $emit them to the Vue.js component. When a user selects another task, the ‘onTaskIdChange‘ event fires as the task ID changes and it enables us to keep track of the newly selected tasks.
Now we open the App.vue file and add a handler for the tasks selected:
{{ src/App.vue }}
<template>
  <div class="container">
    <div class="right-container">
      <div class="gantt-selected-info">
        <div v-if="selectedTask">
          <h2>{{selectedTask.text}}</h2>
          <span><b>ID: </b>{{selectedTask.id}}</span><br/>
          <span><b>Progress: </b>{{selectedTask.progress|toPercent}}%</span><br/>
          <span><b>Start Date: </b>{{selectedTask.start_date|niceDate}}</span><br/>
          <span><b>End Date: </b>{{selectedTask.end_date|niceDate}}</span><br/>
        </div>

        <div v-else class="select-task-prompt">
          <h2>Click any task</h2>
        </div>
      </div>

      <ul class="gantt-messages">
        <li class="gantt-message" v-for="message in messages" v-bind:key="index">
                                  {{message}}</li>
      </ul>
    </div>
    <gantt class="left-container" :tasks="tasks" @task-updated="logTaskUpdate"
           @link-updated="logLinkUpdate" @task-selected="selectTask"></gantt>
  </div>
</template>
Don’t forget to specify the styles in the App.vue file for displaying the information about the selected tasks the way you need:
<style>
.gantt-selected-info {

    border-bottom: 1px solid #cecece;
    box-sizing: border-box;
    font-family: Geneva, Arial, Helvetica, sans-serif;
    height: 50%;
    line-height: 28px;
    padding: 10px;
  }

  .gantt-selected-info h2 {
    border-bottom: 1px solid #cecece;
  }

  .select-task-prompt h2{
    color: #d9d9d9;
  }

</style>
So here, we added a new container bound to the selectedTask property of the App.vue component using “v-if” directive and a handler for the “task-selected” event we now emit. Now, we need to add the following property to the App.vue component right after the messages property:
{{ src/App.vue }}
   selectedTask: null
Additionally, among other methods, we need to specify the selectTask method used in the selection handler we added above:
{{ src/App.vue }}
   selectTask: function(task){
     this.selectedTask = task
   }
As a result, when a user selects a task in our Gantt chart, the Gantt component emits the ‘task-selected’ event. Then this event is captured by the App.vue component. The selectedTask property is updated and triggers a repaint of the .gantt-selected-info element with task details.
And the icing on the cake, let’s make the information about the selected tasks look nice and readable.
We can apply the toPercent and niceDate filters to display the progress completion and start and end dates in a human-friendly way:
{{ src/App.vue }}

filters: {
    toPercent (val) {
      if(!val) return '0'
      return Math.round((+val) * 100)
    },
    niceDate (obj){
      return '${obj.getFullYear()} / ${obj.getMonth()} / ${obj.getDate()}'
    }
  }
And here is the final result! Try dragging a progress bar of a task or prolonging a task and you should see how the progress percent and end dates change on the right:
Conclusion
Vue.js enables developers with almost any level of skills to create web applications in a matter of hours. dhtmlxGantt open source library can be used for embedding neat Gantt charts into Vue-based apps with little effort. Thus, you can quickly develop a basic project management app, which is able to listen to user actions and react to them in the way you need.
License
This article, along with any associated source code and files, is licensed under The GNU General Public License (GPLv3).
Building web apps since 2001. Rich experience in HTML frontends for different platforms.


 General
  News
News  Suggestion
  Question
  Bug
Bug  Answer
  Joke
Joke  Praise
  Rant
Rant  Admin
Admin 


