I recently had an interesting issue in one of our applications. The SMS router, responsible for sending and receiving SMSes, hanged – there was no CPU usage and we haven’t observed any activity in the application logs. I collected a full memory dump and restarted the service, which seemed to come back to its normal state. Curious what happened, I opened the dump in WinDbg, loaded PDE and SOS and started an investigation.
When analysing hanging application, I usually start by listing all process threads with their call stacks: ~*e!CLRStack. If you can’t see any Monitor.Waits on the stacks, you probably need to examine native stacks (with !DumpStack or k commands). In our case, stacks seem to indicate a hang in managed code:
<small>...
OS Thread Id: 0xdb4 (5)
Child SP       IP Call Site
04f9ed60 778aca2c [GCFrame: 04f9ed60]
04f9ef00 778aca2c [GCFrame: 04f9ef00]
04f9eeb0 778aca2c [HelperMethodFrame: 04f9eeb0] System.Threading.Monitor.ReliableEnter(System.Object, Boolean ByRef)
04f9ef40 73a2d887 System.Threading.Monitor.Enter(System.Object, Boolean ByRef)
04f9ef50 73483b89 System.Diagnostics.TraceSource.TraceEvent(System.Diagnostics.TraceEventType, Int32, System.String)
...
OS Thread Id: 0x1220 (6)
Child SP       IP Call Site
050ded18 778aca2c [GCFrame: 050ded18]
050deebc 778aca2c [GCFrame: 050deebc]
050dee6c 778aca2c [HelperMethodFrame: 050dee6c] System.Threading.Monitor.ReliableEnter(System.Object, Boolean ByRef)
050deefc 72e3b9fa System.Diagnostics.DiagnosticsConfiguration.Initialize()
050def2c 72e3c06c System.Diagnostics.DiagnosticsConfiguration.get_SwitchSettings()
050def34 72e3c01a System.Diagnostics.Switch.InitializeConfigSettings()
050def40 72e3be34 System.Diagnostics.Switch.InitializeWithStatus()
050def84 72e3bd99 System.Diagnostics.Switch.get_SwitchSetting()
050def90 72e38594 System.Diagnostics.SourceSwitch.ShouldTrace(System.Diagnostics.TraceEventType)
050def98 72e43e64 System.Diagnostics.TraceSource.TraceEvent(System.Diagnostics.TraceEventType, Int32, System.String, System.Object[])
050deff0 049cf16f MySql.Data.MySqlClient.MySqlTrace.LogWarning(Int32, System.String)
050df008 049ce938 MySql.Data.MySqlClient.MySqlConnection.HandleTimeoutOrThreadAbort(System.Exception)
050df100 03a8d7c7 MySql.Data.MySqlClient.MySqlCommand.ExecuteReader(System.Data.CommandBehavior)
050df218 0479219f MySql.Data.MySqlClient.MySqlCommand.ExecuteNonQuery()
050df248 0556a7cf Dapper.SqlMapper.ExecuteCommand(System.Data.IDbConnection, Dapper.CommandDefinition ByRef, System.Action`2)
050df280 0556777e Dapper.SqlMapper.ExecuteImpl(System.Data.IDbConnection, Dapper.CommandDefinition ByRef)
050df2e4 05567460 Dapper.SqlMapper.Execute(System.Data.IDbConnection, System.String, System.Object, System.Data.IDbTransaction, System.Nullable`1, System.Nullable`1)
...
OS Thread Id: 0xdf0 (7)
Child SP       IP Call Site
0521ea44 778aca2c [GCFrame: 0521ea44]
0521eb1c 778aca2c [GCFrame: 0521eb1c]
0521eb38 778aca2c [HelperMethodFrame_1OBJ: 0521eb38] System.Threading.Monitor.ReliableEnter(System.Object, Boolean ByRef)
0521ebb4 72e3bdf9 System.Diagnostics.Switch.InitializeWithStatus()
0521ebf8 72e3bd99 System.Diagnostics.Switch.get_SwitchSetting()
0521ec04 72e38594 System.Diagnostics.SourceSwitch.ShouldTrace(System.Diagnostics.TraceEventType)
0521ec0c 72e43e64 System.Diagnostics.TraceSource.TraceEvent(System.Diagnostics.TraceEventType, Int32, System.String, System.Object[])
0521ec64 049cf16f MySql.Data.MySqlClient.MySqlTrace.LogWarning(Int32, System.String)
0521ec7c 049ce938 MySql.Data.MySqlClient.MySqlConnection.HandleTimeoutOrThreadAbort(System.Exception)
0521ed74 03a8d7c7 MySql.Data.MySqlClient.MySqlCommand.ExecuteReader(System.Data.CommandBehavior)
0521ee8c 0479219f MySql.Data.MySqlClient.MySqlCommand.ExecuteNonQuery()
0521eebc 03a842dd NLog.Targets.DatabaseTarget.WriteEventToDatabase(NLog.LogEventInfo)
0521eef0 03a83fd8 NLog.Targets.DatabaseTarget.Write(NLog.LogEventInfo)
0521ef1c 03a83def NLog.Targets.Target.Write(NLog.Common.AsyncLogEventInfo)
0521ef44 03a83cb6 NLog.Targets.Target.WriteAsyncLogEvent(NLog.Common.AsyncLogEventInfo)
0521ef7c 03a83ad1 NLog.LoggerImpl.WriteToTargetWithFilterChain(NLog.Internal.TargetWithFilterChain, NLog.LogEventInfo, NLog.Common.AsyncContinuation)
0521ef94 03a839f6 NLog.LoggerImpl.Write(System.Type, NLog.Internal.TargetWithFilterChain, NLog.LogEventInfo, NLog.LogFactory)
0521efbc 04607c2f NLog.Logger.WriteToTargets(NLog.LogEventInfo)
0521efd0 04601801 NLog.Logger.Log(NLog.LogEventInfo)
0521efe0 046015d1 NLog.NLogTraceListener.ProcessLogEventInfo(NLog.LogLevel, System.String, System.String, System.Object[], System.Nullable`1, System.Nullable`1, System.Nullable`1)
0521f044 04600efc NLog.NLogTraceListener.TraceEvent(System.Diagnostics.TraceEventCache, System.String, System.Diagnostics.TraceEventType, Int32, System.String, System.Object[])
0521f08c 73483d61 System.Diagnostics.TraceSource.TraceEvent(System.Diagnostics.TraceEventType, Int32, System.String, System.Object[])
...
OS Thread Id: 0xb08 (8)
Child SP       IP Call Site
0538efd4 778aca2c [GCFrame: 0538efd4]
0538f084 778aca2c [HelperMethodFrame_1OBJ: 0538f084] System.Threading.Monitor.ObjWait(Boolean, Int32, System.Object)
0538f108 73aa5d16 System.Threading.Monitor.Wait(System.Object, Int32, Boolean)
0538f118 04de1d85 Quartz.Simpl.SimpleThreadPool+WorkerThread.Run()
0538f158 73a1ab43 System.Threading.ThreadHelper.ThreadStart_Context(System.Object)
...
</small>
In your dumps, you may see even bigger number of waiting threads and for most applications, it would be normal. So before we jump to any conclusions, we need to perform two more steps: analyze locks acquired by those waiting threads and find locks which interfere and cause a deadlock.
Finding Locks
To list all Monitor locks in our application, we can use the !SyncBlk command from the SOS extension:
<small>0:000> !syncblk
Index         SyncBlock MonitorHeld Recursion Owning Thread Info          SyncBlock Owner
  306 0101284c            3         1 04cfe690 df0   7   017489b8 System.Object
  326 01012540            3         1 04cfe158 1220   6   0187258c System.Object
  329 010123a0            5         1 04cfe690 df0   7   0176d584 System.Object
  339 04cf3784            1         1 04cfdc20 db4   5   017b1bec System.Object
  340 04cf37b8            1         1 04cfe690 df0   7   017b1e44 System.Object
  342 04cf3820            1         1 04cfe158 1220   6   017b1d38 System.Object
-----------------------------
Total           344
CCW             0
RCW             1
ComClassFactory 0
Free            320</small>
Let’s then match the result of the above command with objects referenced on the threads stacks (using the !dso command). We will start with threads 6 and 7 as they seem to be most active in locking:
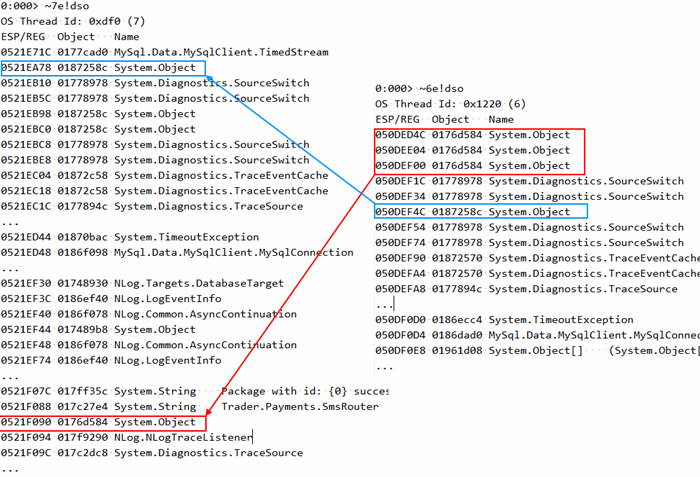
I marked with colors objects the threads are waiting on and it becomes obvious that what we have here is a classic deadlock. Though we still haven’t answered a question: what operations led to this situation?
Timeline Analysis
We found out that the 7th thread is waiting on a lock taken on the object at address 0x0187258c (the top-most on its stack). We also know that at some time in the past, the thread 6 has successfully acquired this lock and is still holding it. We will probably gain better understanding by checking the C# code responsible for those waits. For the 7th thread it’s straightforward – after decompiling System.Diagnostics.Switch.InitializeWithStatus, i.e., the method pointed by the top-most stack frame after System.Threading.Monitor.ReliableEnter, we get:
<small>namespace System.Diagnostics {
    ...
    public abstract class Switch {
        ...
        private object m_intializedLock;
        ...
        private object IntializedLock {
            [SuppressMessage("Microsoft.Concurrency", "CA8001", Justification = "Reviewed for thread-safety")]
            get {
                if (m_intializedLock == null) {
                    Object o = new Object();
                    Interlocked.CompareExchange<Object>(ref m_intializedLock, o, null);
                }

                return m_intializedLock;
            }
        }
        ...
        private bool InitializeWithStatus() {
            if (!initialized) {

                lock (IntializedLock) {

                    if (initialized || initializing) {
                        return false;
                    }
                    ....</small>
So we are waiting here on a private SourceSwitch lock. We know the SourceSwitch address (from the !dso command output) so we may dump it:
<small>0:007> !DumpObj /d 01778978
Name:        System.Diagnostics.SourceSwitch
MethodTable: 72ebe134
EEClass:     72c9d164
Size:        44(0x2c) bytes
File:        C:\Windows\Microsoft.Net\assembly\GAC_MSIL\System\v4.0_4.0.0.0__b77a5c561934e089\System.dll
Fields:
      MT    Field   Offset                 Type VT     Attr    Value Name
72ebf520  4000547        4 ...lementsCollection  0 instance 00000000 switchSettings
73b23e18  4000548        8        System.String  0 instance 01721228 description
73b23e18  4000549        c        System.String  0 instance 017788ec displayName
...
73b241b8  4000550       1c        System.Object  0 instance 0187258c m_intializedLock
...

0:007> !DumpObj /d 017788ec
Name:        System.String
MethodTable: 73b23e18
EEClass:     737238f0
Size:        24(0x18) bytes
File:        C:\Windows\Microsoft.Net\assembly\GAC_32\mscorlib\v4.0_4.0.0.0__b77a5c561934e089\mscorlib.dll
String:      mysql
...</small>
It becomes clear that the 7th thread is trying to log something related to mysql. By checking its call stack, we may guess that the MySql driver attempted to log a warning about a timeout exception which had occurred in the connection. We need to discover when the 6th thread obtained the given lock. We know that the locked object is referenced on the 6th thread stack at address 0x050DEF4C which matches a call to the System.Diagnostics.Switch.InitializeWithStatus() function (child SP at 0x050def40):
<small>050def34 72e3c01a System.Diagnostics.Switch.InitializeConfigSettings()
050def40 72e3be34 System.Diagnostics.Switch.InitializeWithStatus()
050def84 72e3bd99 System.Diagnostics.Switch.get_SwitchSetting()
</small>
By checking the SourceSwitch instance address, we may be sure that it’s the same instance that blocked the 7th thread. Additionally, it’s even the same situation – the MySql driver tries to log a connection timeout.
It’s time to perform a similar investigation for an object on which the 6th thread is waiting. The top-most method on the 6th thread stack, just after System.Threading.Monitor.ReliableEnter, is System.Diagnostics.DiagnosticsConfiguration.Initialize with an easy-to-spot lock statement:
<small>namespace System.Diagnostics {
...
internal static class DiagnosticsConfiguration {
...
internal static void Initialize() {
lock (TraceInternal.critSec) {
...
}
}
...
}
...
}</small>
We can see that the 6th thread is waiting on a global lock which is used in initializing tracing in the System.Diagnostics classes. On the 7th thread stack, the object is referenced at address 0x0521F090 which points us to the System.Diagnostics.TraceSource.TraceEvent method:
<small>
0521f044 04600efc NLog.NLogTraceListener.TraceEvent(System.Diagnostics.TraceEventCache, System.String, ...
0521f08c 73483d61 System.Diagnostics.TraceSource.TraceEvent(System.Diagnostics.TraceEventType, Int32 ...
0521f0e4 04604e45 ...SmsRouter.SmsProcessing.SmsReceiveJob.CollectSmsMessagesFromProvider(...</small>
After decompiling, we can easily find the lock statement:
<small>public void TraceEvent(TraceEventType eventType, int id, string format, params object[] args)
{
  this.Initialize();
  TraceEventCache eventCache = new TraceEventCache();
  if (!this.internalSwitch.ShouldTrace(eventType) || this.listeners == null)
    return;
  if (TraceInternal.UseGlobalLock)
  {
    lock (TraceInternal.critSec)
    ...</small>
To summarize, the hypothetical scenario that led to the failure could be as follows:
- Code running on the 7th thread tried to save a log using the
TraceSource.TraceEvent method and acquired the global trace log. Then forwarded the call to the NLogTraceListener which called DatabaseTarget.Write. - Code running on the 6th thread failed while saving data to the MySql database and the ADO.NET driver tried to log the warning into the
System.Diagnostics trace – in order to check the mysql SwitchSource value the switch needed to be initialized (internal switch lock acquired) which required gaining ownership over the global trace lock – BLOCKED by the 7th thread - Code running on the 7th thread failed while saving the log to the MySql database and the ADO.NET driver tried to save the warning into the
System.Diagnostics trace – in order to check the mysql SwitchSource value, the switch needed to be initialized – BLOCKED by the 6th thread and DEADLOCKED.
If the database was responsive, the problem probably would not occur as no log from MySql driver would ever be generated. A way to resolve this issue is to disable global locking for trace listeners – this can be achieved through the application config file, e.g..:
<small><configuration>
  <system.diagnostics>
    <trace useGlobalLock="false" />
  </system.diagnostics>
</configuration></small>
It is safe, because even if this setting is off and the trace listener does not support multi-threading (IsThreadSafe property returns false), the global lock will be used. In our case, the NLogTraceListener supports multi-threading so the lock won’t be taken.
I hope you found in this post some useful tips for debugging threading issues in .NET code. If you have any interesting tips on debugging locking issues, please share them in the comments.
Filed under: CodeProject, Diagnosing threading issues 


 General
  News
News  Suggestion
  Question
  Bug
Bug  Answer
  Joke
Joke  Praise
  Rant
Rant  Admin
Admin 


