Click here to Skip to main content
15,890,436 members
Articles / Programming Languages / C#
Article

Benchmarking Direct, Delegate and Reflection Method Invocations

Rate me:
Please Sign up or sign in to vote.
4.61/5 (16 votes)
5 Jan 20032 min read 141.2K   446   30   32
This console mode applet illustrates the significant performance hit of methods invoked using reflection.

Introduction

This article was inspired by:

Both of these articles have inspired me to do some benchmarking of the three forms of function invocation offered in C#:

  • Direct call
  • via a delegate
  • via reflection

As I am in the prototyping stages of an "application automation layer" (The Application Automation Layer: Introduction And Design [^] and The Application Automation Layer - Design And Implementation of The Bootstrap Loader And The Component Manager [^]) which currently relies heavily on method invocation via reflection, I thought I should take the advice of both of these articles and look at the performance of my current implementation.

The results are rather astonishing.

Benchmarking C#

Didn't I read somewhere on CP that the Microsoft license agreement specifically says "thou shalt not benchmark .NET!"? Well, that's yet another commandment I've broken.

I decided to write a really simple benchmarking program, not for the purposes of gleaning minor differences between the three types of function invocation, but to determine if there are any large differences. The benchmark program compares:

Benchmark Matrix
TypeDirectDelegateReflection
Static, No parameters---
Static, With parameters---
Instance, No parameters---
Instance, With parameters---

The results are as follows:

Image 1

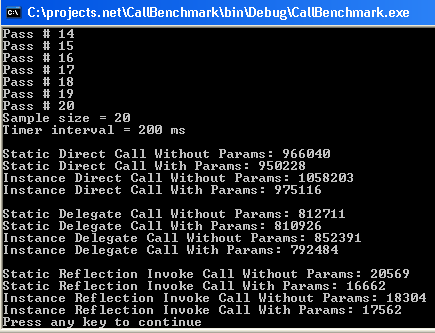
You will notice that reflection is approximately 50 times slower than direct calls. This means that I am going to have to seriously reconsider my implementation in the AAL!

Some Code

The program benchmarks twelve different types of invocation. They all look basically like this:

C#
public static void StaticDirectCallWithoutParams()
{
    ++count;
}

simply consisting of a counter increment.

At the beginning of the program, the delegates and reflection methods are initialized along with a couple of embedded constants controlling the number of times the test is run, and how many milliseconds we spend calling the function under test:

C#
CallBenchmark cb=new CallBenchmark();

SNPCall snpCall=new SNPCall(StaticDelegateWithoutParams);
SPCall spCall=new SPCall(StaticDelegateWithParams);
INPCall inpCall=new INPCall(cb.InstanceDelegateWithoutParams);
IPCall ipCall=new IPCall(cb.InstanceDelegateWithParams);

MethodInfo snpMI=GetMethodInfo
 ("CallBenchmark.exe/CallBenchmark.CallBenchmark/StaticInvokeWithoutParams");
MethodInfo spMI=GetMethodInfo
 ("CallBenchmark.exe/CallBenchmark.CallBenchmark/StaticInvokeWithParams");
MethodInfo inpMI=GetMethodInfo
 ("CallBenchmark.exe/CallBenchmark.CallBenchmark/InstanceInvokeWithoutParams");
MethodInfo ipMI=GetMethodInfo
 ("CallBenchmark.exe/CallBenchmark.CallBenchmark/InstanceInvokeWithParams");

int sampleSize=20;    // # of samples
int timerInterval=200;  // in ms

A timer is set up to stop the test:

C#
Timer timer=new Timer(timerInterval);
timer.AutoReset=false;
timer.Stop();
timer.Elapsed+=new ElapsedEventHandler(OnTimerEvent);

...

static void OnTimerEvent(object src, ElapsedEventArgs e)
{
    done=true;
}

And each test looks something like this:

C#
++n;
count=0;
done=false;
timer.Start();
while (!done)
{
    StaticDirectCallWithParams(1, 2, 3);
}
benchmarks[n]+=count;

Rocket science, isn't it?

Conclusion

This little test clearly shows the performance hit taken by invoking methods using reflection. Even considerations like CPU caching wouldn't account for this significant variance (I think!). Obviously, I need to rethink my architecture implementation.

License

This article has no explicit license attached to it but may contain usage terms in the article text or the download files themselves. If in doubt please contact the author via the discussion board below.

A list of licenses authors might use can be found here


Written By
Architect Interacx
United States United States
Blog: https://marcclifton.wordpress.com/
Home Page: http://www.marcclifton.com
Research: http://www.higherorderprogramming.com/
GitHub: https://github.com/cliftonm

All my life I have been passionate about architecture / software design, as this is the cornerstone to a maintainable and extensible application. As such, I have enjoyed exploring some crazy ideas and discovering that they are not so crazy after all. I also love writing about my ideas and seeing the community response. As a consultant, I've enjoyed working in a wide range of industries such as aerospace, boatyard management, remote sensing, emergency services / data management, and casino operations. I've done a variety of pro-bono work non-profit organizations related to nature conservancy, drug recovery and women's health.

Comments and Discussions

 
GeneralThe difference with method body is different (45 % - 50%) Pin
mud7715-May-06 10:42
mud7715-May-06 10:42 
Generalpoor performance of delegates Pin
hnipak5-Aug-03 23:47
hnipak5-Aug-03 23:47 
GeneralOne question Pin
mcarbenay14-Jan-03 10:55
mcarbenay14-Jan-03 10:55 
GeneralRe: One question Pin
Marc Clifton14-Jan-03 12:14
mvaMarc Clifton14-Jan-03 12:14 
GeneralMy thoughts again Pin
leppie7-Jan-03 7:20
leppie7-Jan-03 7:20 
GeneralRe: My thoughts again Pin
Marc Clifton7-Jan-03 11:16
mvaMarc Clifton7-Jan-03 11:16 
GeneralRe: My thoughts again Pin
leppie7-Jan-03 11:54
leppie7-Jan-03 11:54 
GeneralRe: My thoughts again Pin
Jonathan de Halleux22-Sep-03 4:06
Jonathan de Halleux22-Sep-03 4:06 
GeneralComment Pin
Jörgen Sigvardsson7-Jan-03 6:40
Jörgen Sigvardsson7-Jan-03 6:40 
GeneralRe: Comment Pin
Marc Clifton7-Jan-03 11:14
mvaMarc Clifton7-Jan-03 11:14 
GeneralRe: Comment Pin
Jörgen Sigvardsson7-Jan-03 12:02
Jörgen Sigvardsson7-Jan-03 12:02 
GeneralRe: Comment Pin
Marc Clifton7-Jan-03 12:04
mvaMarc Clifton7-Jan-03 12:04 
GeneralWith optimized code... Pin
Wesner Moise6-Jan-03 19:16
Wesner Moise6-Jan-03 19:16 
GeneralRe: With optimized code... Pin
Marc Clifton7-Jan-03 12:10
mvaMarc Clifton7-Jan-03 12:10 
GeneralRe: With optimized code... Pin
David Stone7-Jan-03 19:11
sitebuilderDavid Stone7-Jan-03 19:11 
GeneralRe: With optimized code... Pin
Marc Clifton8-Jan-03 0:34
mvaMarc Clifton8-Jan-03 0:34 
GeneralRe: With optimized code... Pin
David Stone8-Jan-03 8:16
sitebuilderDavid Stone8-Jan-03 8:16 
GeneralRe: With optimized code... Pin
Marc Clifton8-Jan-03 10:03
mvaMarc Clifton8-Jan-03 10:03 
GeneralRe: With optimized code... Pin
David Stone8-Jan-03 13:50
sitebuilderDavid Stone8-Jan-03 13:50 
GeneralRe: With optimized code... Pin
swythan15-Jan-03 0:50
swythan15-Jan-03 0:50 
GeneralRe: With optimized code... Pin
Marc Clifton15-Jan-03 1:06
mvaMarc Clifton15-Jan-03 1:06 
GeneralEval Option Pin
Wesner Moise6-Jan-03 19:06
Wesner Moise6-Jan-03 19:06 
GeneralRe: Eval Option Pin
Jörgen Sigvardsson7-Jan-03 6:35
Jörgen Sigvardsson7-Jan-03 6:35 
GeneralSome thoughts... Pin
Matt Gullett6-Jan-03 17:24
Matt Gullett6-Jan-03 17:24 
GeneralRe: Some thoughts... Pin
Marc Clifton7-Jan-03 1:18
mvaMarc Clifton7-Jan-03 1:18 
Hi Matt,

Abstractions always have a cost, don't they.

Definitely. What I'm is a different implementation of the primary abstraction--using delegates instead of reflection. And this is where prototyping and benchmarking is invaluable and can often affect the design.

If the method call being used as the test does not come close to representing real-world scenario it really isn't that valid of a test.

Excellent point! I remember when I used Borland's profiler for some DOS code and consistently, where I thought the problems were, I was wrong. The same thing is true for performance testing, as your example illustrated.

However, in my usage of the AAL in C++/MFC, I notice that I'm almost always stringing process calls together into workflows at the script level and often doing iteration things. So, performance of the indirect call is fairly high in the overall ranking of performance issues (I think!)

BTW, I noticed your article just yesterday when I was getting the link to the "quality" article. It must have flown onto and off of the "last 10 articles" screen! I glanced at it briefly but I'll read it more thoroughly today.

If you run the simple demo and use zero as the function time and then again with a function time of say 2 or 3 milliseconds, you will notice that the results tend to even-out especially for the IsBadReadPtr and IsBadWritePtr related tests.

Isn't this simply because the test takes microseconds while the function takes milliseconds, and therefore the percent of time spent on the test is negligible with regards to the entire function? I've run into this problem myself.

Basically, if a function can execute within a single timeslice

Hmmm. I thought with a pre-emptive multitasker it can jump to another process no matter where it is in the code. Of course, this depends on what kind of code you're executing. If it's a message invoked function, then yes, after your function exits and there are no more messages to process, the framework (whether MFC or .NET, I believe) releases the remaining timeslice.

Makes benchmarking Windows apps a real pain, doesn't it!

BTW, another thing you can play with in C++ (and probably in C#) is setting the thread priority. I've had very interesting and unexpected (as in, not good) results when I do that, but it can help take out the timeslice issue from the equation.

Marc

Help! I'm an AI running around in someone's f*cked up universe simulator.
Sensitivity and ethnic diversity means celebrating difference, not hiding from it. - Christian Graus
Every line of code is a liability - Taka Muraoka

General General    News News    Suggestion Suggestion    Question Question    Bug Bug    Answer Answer    Joke Joke    Praise Praise    Rant Rant    Admin Admin   

Use Ctrl+Left/Right to switch messages, Ctrl+Up/Down to switch threads, Ctrl+Shift+Left/Right to switch pages.