Introduction
Part 3 of the tutorial will cover some of the common issues when trying to setup dashboards in the hopes that someone might come up with better solutions than the ones I have. :)
Background
This is the third article of a 4 part series. You can find my other articles here:
Using the code
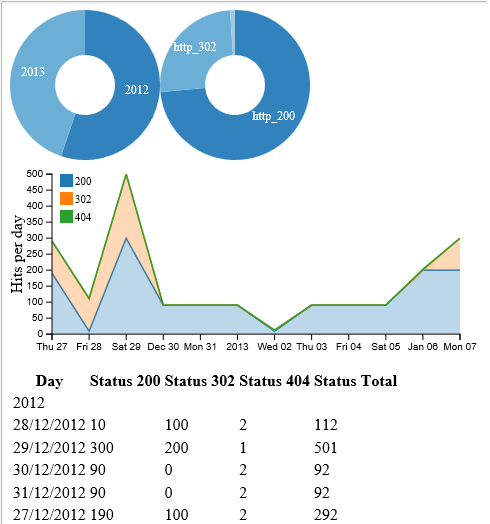
If you remember in part 2, we used the following data for our graphs.
var data = [
    {date: "12/27/2012", http_404: 2, http_200: 190, http_302: 100},
    {date: "12/28/2012", http_404: 2, http_200: 10, http_302: 100},
    {date: "12/29/2012", http_404: 1, http_200: 300, http_302: 200},
    {date: "12/30/2012", http_404: 2, http_200: 90, http_302: 0},
    {date: "12/31/2012", http_404: 2, http_200: 90, http_302: 0},
    {date: "01/01/2013", http_404: 2, http_200: 90, http_302: 0},
    {date: "01/02/2013", http_404: 1, http_200: 10, http_302: 1},
    {date: "01/03/2013", http_404: 2, http_200: 90, http_302: 0},
    {date: "01/04/2013", http_404: 2, http_200: 90, http_302: 0},
    {date: "01/05/2013", http_404: 2, http_200: 90, http_302: 0},
    {date: "01/06/2013", http_404: 2, http_200: 200, http_302: 1},
    {date: "01/07/2013", http_404: 1, http_200: 200, http_302: 100}
    ];
Since we have a stacked chart, it can sometimes be hard to see how much each of the individual status is taking up, especially if we add more types; or we might want to only show 200 and 302 values and not 404s. To do this, we can create another pie chart similar to the year pie chart. However, we would need the data to be in the following format.
 "total(3) = [
    {"key":"http_404","value":920},
    {"key":"http_302","value":500},
    {"key":"http_200","value":300}
]"
Crossfilter can do some pretty cool stuff, but it can't sum up columns and since
dc.js needs a crossfilter object to interact with the other graphs, we can't just format the array that way and feed it to the graph. This seems to be one of the most frustrating issues with new users. From our crossfilter examples in part 1 and the pie chart broken down by year, we know that in order to do this, we need our data in another format:
var data = [
    {"status":"http_302","hits":0,"date":"01/03/2013"},
    {"status":"http_200","hits":90,"date":"01/03/2013"},
    {"status":"http_200","hits":200,"date":"01/07/2013"},
    {"status":"http_302","hits":1,"date":"01/06/2013"},
    {"status":"http_200","hits":200,"date":"01/06/2013"},
    {"status":"http_404","hits":2,"date":"01/06/2013"},
    {"status":"http_302","hits":0,"date":"01/05/2013"},
    {"status":"http_200","hits":90,"date":"01/05/2013"},
    {"status":"http_404","hits":2,"date":"01/05/2013"},
    {"status":"http_302","hits":0,"date":"01/04/2013"},
    {"status":"http_200","hits":90,"date":"01/04/2013"},
    {"status":"http_404","hits":2,"date":"01/04/2013"},
    {"status":"http_302","hits":100,"date":"01/07/2013"},
    {"status":"http_404","hits":1,"date":"01/07/2013"},
    {"status":"http_404","hits":2,"date":"01/03/2013"},
    {"status":"http_302","hits":1,"date":"01/02/2013"},
    {"status":"http_200","hits":10,"date":"01/02/2013"},
    {"status":"http_404","hits":1,"date":"01/02/2013"},
    {"status":"http_302","hits":0,"date":"01/01/2013"},
    {"status":"http_200","hits":90,"date":"01/01/2013"},
    {"status":"http_404","hits":2,"date":"01/01/2013"},
    {"status":"http_302","hits":0,"date":"12/31/2012"},
    {"status":"http_200","hits":90,"date":"12/31/2012"},
    {"status":"http_302","hits":100,"date":"12/27/2012"},
    {"status":"http_404","hits":2,"date":"12/27/2012"},
    {"status":"http_200","hits":90,"date":"12/30/2012"},
    {"status":"http_404","hits":2,"date":"12/30/2012"},
    {"status":"http_302","hits":200,"date":"12/29/2012"},
    {"status":"http_200","hits":300,"date":"12/29/2012"},
    {"status":"http_404","hits":1,"date":"12/29/2012"},
    {"status":"http_302","hits":100,"date":"12/28/2012"},
    {"status":"http_200","hits":10,"date":"12/28/2012"},
    {"status":"http_404","hits":2,"date":"12/28/2012"},
    {"status":"http_200","hits":190,"date":"12/27/2012"},
    {"status":"http_404","hits":2,"date":"12/31/2012"},
    {"status":"http_302","hits":0,"date":"12/30/2012"}
];
We've now gone from 12 x 4=48 items in easy to read rows to 36 x 3=108! Not cool.
### Sidebar ###
It is possible to render a chart without using crossfilter using the data attribute; however, since the filterings depend on it, you still won't be able to click on it and have it change the other charts without more work. Here is a quick example derived from a usergroup answer
statusRingChart
    .width(150).height(150)
    .dimension({})
    .group({})
    .data(function() {return [
        {"key":"http_200","value":1450},
        {"key":"http_302","value":502},
        {"key":"http_404","value":21}];
        }
    )
    .innerRadius(30);
### Sidebar ###
### TIP ###
If you are unable to reformat the way you receive the data, you can try using melt.js. Melt was made for just this scenario. Note: you will need to do this before using crossfilter, so that filtering on the data will take effect on all dimensions associated with the filter. Here is a quick example. We feed melt our array, what we don't want to melt - the date column, and what we want the new column to be. This will then melt columns http_404, http_302 and http_200 into the new "status" column. We can then use it as if it were our original data and make a dimension out of it. You'll also notice that it creates an _id column when it does this which can be handy to tie everything back together if you need to.
var ndx2 = crossfilter(melt(data,["date"],"status"));
var meltedDim  = ndx2.dimension(function(d) {return d.status;});
print_filter("meltedDim");
"meltedDim(36) = [
    {"status":"http_404","value":2,"_id":7,"date":"01/03/2013"},
    {"status":"http_404","value":2,"_id":1,"date":"12/28/2012"},
    {"status":"http_404","value":1,"_id":11,"date":"01/07/2013"},
    {"status":"http_404","value":2,"_id":3,"date":"12/30/2012"},
    {"status":"http_404","value":2,"_id":0,"date":"12/27/2012"},
    {"status":"http_404","value":2,"_id":10,"date":"01/06/2013"},
    {"status":"http_404","value":1,"_id":2,"date":"12/29/2012"},
    {"status":"http_404","value":2,"_id":4,"date":"12/31/2012"},
    {"status":"http_404","value":2,"_id":9,"date":"01/05/2013"},
    {"status":"http_404","value":2,"_id":5,"date":"01/01/2013"},
    {"status":"http_404","value":1,"_id":6,"date":"01/02/2013"},
    {"status":"http_404","value":2,"_id":8,"date":"01/04/2013"},
    {"status":"http_302","value":0,"_id":9,"date":"01/05/2013"},
    {"status":"http_302","value":100,"_id":0,"date":"12/27/2012"},
    {"status":"http_302","value":100,"_id":11,"date":"01/07/2013"},
    {"status":"http_302","value":1,"_id":6,"date":"01/02/2013"},
    {"status":"http_302","value":0,"_id":3,"date":"12/30/2012"},
    {"status":"http_302","value":100,"_id":1,"date":"12/28/2012"},
    {"status":"http_302","value":0,"_id":7,"date":"01/03/2013"},
    {"status":"http_302","value":1,"_id":10,"date":"01/06/2013"},
    {"status":"http_302","value":0,"_id":8,"date":"01/04/2013"},
    {"status":"http_302","value":0,"_id":4,"date":"12/31/2012"},
    {"status":"http_302","value":200,"_id":2,"date":"12/29/2012"},
    {"status":"http_302","value":0,"_id":5,"date":"01/01/2013"},
    {"status":"http_200","value":10,"_id":6,"date":"01/02/2013"},
    {"status":"http_200","value":90,"_id":8,"date":"01/04/2013"},
    {"status":"http_200","value":90,"_id":5,"date":"01/01/2013"},
    {"status":"http_200","value":90,"_id":4,"date":"12/31/2012"},
    {"status":"http_200","value":90,"_id":9,"date":"01/05/2013"},
    {"status":"http_200","value":200,"_id":10,"date":"01/06/2013"},
    {"status":"http_200","value":90,"_id":3,"date":"12/30/2012"},
    {"status":"http_200","value":300,"_id":2,"date":"12/29/2012"},
    {"status":"http_200","value":10,"_id":1,"date":"12/28/2012"},
    {"status":"http_200","value":200,"_id":11,"date":"01/07/2013"},
    {"status":"http_200","value":190,"_id":0,"date":"12/27/2012"},
    {"status":"http_200","value":90,"_id":7,"date":"01/03/2013"}
]"
### TIP ###
Since we've changed the format of the table, we need to go through our logic and replace the old columns which no longer exist.
We no longer can have a simple total column.
We can change the
year_total to just sum up the hits which contains all the statuses.
var year_total = yearDim.group().reduceSum(function(d) {return d.hits;}); We need to change the logic a bit to calulate the different series. Not too much work.
var status_200=dateDim.group().reduceSum(function(d)
{if (d.status==='http_200') {return d.hits;}else{return 0;}});
var status_302=dateDim.group().reduceSum(function(d)
{if (d.status==='http_302') {return d.hits;}else{return 0;}});
var status_404=dateDim.group().reduceSum(function(d)
{if (d.status==='http_404') {return d.hits;}else{return 0;}}); And lastly the table. This turns out to be a little more complicated. I don't want to show the user the raw table that I'm using because it is kind of verbose. I'd like to keep it as similar to what we had before. Luckily, crossfilter can help us out with the reduce function. Reduce is able to flatten a dataset into key value pairs similar to the
reduceSum function we've been using. ReduceInitial allows you to set the initial state of any variables like setting them to 0.
ReduceAdd and ReduceRemove let's you alter items being added or subtracted from the filter such as when someone clicks on our
dc.js pie chart. P is the value object we are reducing to and v is the current object. Basically, we want to have an entry of each status type equal to what its 'hits' is. When that object is filtered out, we want to set it to 0.
var tableGroup = dateDim.group().reduce(
  function reduceAdd(p,v) {
    p[v.status] = v.hits;
    p["Year"]= v.Year;
    return p;
  },
  function reduceRemove(p,v) {
    p[v.status] = 0;
    p["Year"]=v.Year;

    return p;
  },
  function reduceInitial() { return {}; }
  );
The resulting dataset looks like the following:
"tableGroup(12) = [
   {"key":"2012-12-28T05:00:00.000Z","value":{"http_302":100,"Year":2012,"http_200":10,"http_404":2}},
   {"key":"2012-12-29T05:00:00.000Z","value":{"http_302":200,"Year":2012,"http_200":300,"http_404":1}},
   {"key":"2012-12-30T05:00:00.000Z","value":{"http_200":90,"Year":2012,"http_404":2,"http_302":0}},
   {"key":"2012-12-31T05:00:00.000Z","value":{"http_302":0,"Year":2012,"http_200":90,"http_404":2}},
   {"key":"2013-01-01T05:00:00.000Z","value":{"http_302":0,"Year":2013,"http_200":90,"http_404":2}},
   {"key":"2013-01-02T05:00:00.000Z","value":{"http_302":1,"Year":2013,"http_200":10,"http_404":1}},
   {"key":"2013-01-03T05:00:00.000Z","value":{"http_302":0,"Year":2013,"http_200":90,"http_404":2}},
   {"key":"2013-01-04T05:00:00.000Z","value":{"http_302":0,"Year":2013,"http_200":90,"http_404":2}},
   {"key":"2013-01-05T05:00:00.000Z","value":{"http_302":0,"Year":2013,"http_200":90,"http_404":2}},
   {"key":"2013-01-06T05:00:00.000Z","value":{"http_302":1,"Year":2013,"http_200":200,"http_404":2}},
   {"key":"2013-01-07T05:00:00.000Z","value":{"http_200":200,"Year":2013,"http_302":100,"http_404":1}},
   {"key":"2012-12-27T05:00:00.000Z","value":{"http_302":100,"Year":2012,"http_404":2,"http_200":190}}];
### Tip ###
When converting values to a key like "http_200" make sure they are not set to a just a number like "200" which would not be a valid key.
### Tip ###
The table definition would then look like the following, where we now need to go into the key object to get the date and the value object to get the right secondary key. For the date, make sure to add 1 since javascript months start at 0.:
datatable
    .dimension(tableGroup)
    .group(function(d) {return d.value.Year;})
    .columns([
        function(d) {return d.key.getDate() + "/" +
             (d.key.getMonth() + 1) + "/" + d.key.getFullYear(); },
        function(d) {return d.value.http_200;},
        function(d) {return d.value.http_302;},
        function(d) {return d.value.http_404;},
        function(d) {return d.value.http_200+d.value.http_302+d.value.http_404;}
    ]);
Ok, that was a little complicated. Getting back to the task at hand, the last bit is much easier. We can now setup the status ring like we did with the yearly one: set the HTML DOM object, sync it up with the
JavaScript based on a status dimension and use the simple reduceSum function.
<div id="chart-ring-status"></div>
var statusRingChart = dc.pieChart("#chart-ring-status");
var statusDim = ndx.dimension(function(d) {return d.status;});
var hit_status = statusDim.group().reduceSum(function(d) {return d.hits;});
statusRingChart
.width(150).height(150)
.dimension(statusDim)
.group(hit_status)
.innerRadius(30); When you're all done it should now look like this:
OK, now let's tackle something a little simpler. We're going to clean up the chart a little bit. You've probably noticed that the graph when it updates, doesn't change the x-axis even though we have the min and max date set using crossfilter. Instead it just shrinks the datapoints to 0. I'm not totally sure why this is. My guess is that since we're using just a simple variable and not an array for the data, that it actual makes a copy of the value instead of a reference. In order to work around this, we need to make two changes. One, we need to set the
elasticX variable to true for the hitslineChart. By default, the x-axis is locked in it's time range.
.elasticX(true)
Next we'll use the
jQuery reference to listen for clicks on our chart. We'll then update the chart with the new dates and redraw it.
$('#chart-ring-year').on('click', function(){
var minDate2 = dateDim.bottom(1)[0].date;
var maxDate2 = dateDim.top(1)[0].date;
hitslineChart.x(d3.time.scale().domain([minDate2,maxDate2]));
hitslineChart.redraw();
}); Before we take a look at the new behavior, let's change a few other things as well. The x-axis looks a little crowded. We can rotate the labels by 90% to make it a little easier to read. When we rotate the labels, we need to increase the bottom margin of the graph; so the labels don't get cutoff. The right settings are kind of trial and error depending on your font, but easy enough to figure out. Since we changed the margins to add 10px to the right, we now need to add 10px to the legend's x so they don't hug the left axis.
Unfortunately, the labels themselves can't just be set to be rotated - at least not currently. Instead we need to use a renderlet to rotate them after the chart has been drawn. This makes it slightly ugly on the transition as they load horizontally, then snap to being vertical but I think it is worth the
awkwardness to make the axis more readable.
.margins({ top: 10, left: 50, right: 10, bottom: 50 })
.legend(dc.legend().x(60).y(10).itemHeight(13).gap(5))
.renderlet(function (chart) {chart.selectAll("g.x text").attr('dx', '-30').attr(
  'dy', '-7').attr('transform', "rotate(-90)");})
The last thing I want to do is to clean up the mouseovers on the line graphs in order to better determine the values. To do this, we'll set the title attribute of the graph to call a custom function called getvalues.
.title(function(d){ return getvalues(d);} ) Getvalues will use crossfilter to filter our dataset and get all the values for a particular date which we'll loop through to get the number of hits for each of the statuses. This will also mean that the data will update when the graph changes. Once we're done getting our info, we need to erase our filter so it doesn't effect the graphs.
function getvalues(d){
var str=d.key.getDate() + "/" + (d.key.getMonth() + 1) + "/" + d.key.getFullYear()+"\n";
var key_filter = dateDim.filter(d.key).top(Infinity);
var total=0
key_filter.forEach(function(a) {
str+=a.status+": "+a.hits+" Hit(s)\n";
total+=a.hits;
});
str+="Total:"+total;
dateDim.filterAll();
return str;
} ### TIP ###
It's possible to set your own custom-looking point labels to give them a little more style. To do this, you'll need to turn off the charts titles
with the following
.renderTitle(false)
### TIP ###
Our dashboard should now look and behave like the following.

This covers most of the basics. The next articles will focus more on customizing the look and feel of the dashboards.
I'm a Principal Performance Engineer who uses VB.Net, HTML, CSS, etc. to write automation tools and reports.


 General
  News
News  Suggestion
  Question
  Bug
Bug  Answer
  Joke
Joke  Praise
  Rant
Rant  Admin
Admin 


