
GIS Data Visualization of VisualBasic Hybrids with SVG/CSS
4.92/5 (6 votes)
The new VB.NET language that applied in data science
- Download GIS_render
- Download Data.GIS-1.1.1
- Download latest source code from github: https://github.com/xieguigang/Data.GIS
For the furthering development of this program, first install the Microsoft VisualBasic CLI App runtime from nuget:
PM> Install-Package VB_AppFramework -Pre
And then, add reference to these DLL modules:
- Microsoft.VisualBasic.Architecture.Framework_v3.0_22.0.76.201__8da45dcd8060cc9a.dll
- Microsoft.VisualBasic.Data.Csv.dll
- Microsoft.VisualBasic.Imaging.dll
- Microsoft.VisualBasic.MIME.Markup.dll
Acknowledgement
All of the programming idea in this post comes from this article on website VISUAL CINNAMON.
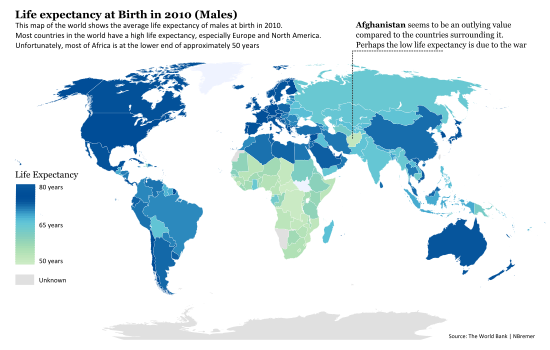
Showing Life Expectancy around the world
Using the Code
1. The Blank World Map SVG
Quote:
Source from wiki: File:BlankMap-World6.svg
Here is the blank map data that I download from wiki and made some tweaks: removed the small region circle to solve the GIMP rendering problem and removed the oceans drawing Polygon path data, so that the final map looks like:
![]()
This modified blank map svg data can be found at my github repository.
2. How to Render the Colors on SVG Polygon?
From the observation on the data structure of the SVG elements in the blank world map data, we can know that all of the svg graphics object g and polygon object path have the style attribute for applying CSS style and id attribute for identify the country or region object, here is an example of the SVG document:
<g style="fill: rgb(204,0,0);" id="fr">
   ...
   <path style="fill: rgb(204,0,0);" class="landxx fr gf eu" id="gf" d="..." />
   <title>France</title>
</g>
So that all we need to do is just find the country or region object by using the id attribute and then calculate the mapped color for that object and set the CSS value string to the style attribute, that we can do our job on this rendering work.
3. The Color Renderer
Using ISO-3166_1 found svg object
The polygon object in the blank world map SVG is using the iso-3166 alpha2 code as identifier, but the problem is that in most situations, we input the data using the country name not this brief code, so that we just use a dictionary to translate the country name or other brief code to the required iso-3166 alpha2 code:
Imports Microsoft.VisualBasic.Serialization.JSON

Public Class ISO_3166

    Public Property name As String
    Public Property alpha2 As String
    Public Property alpha3 As String
    Public Property code As String

    Public Overrides Function ToString() As String
        Return Me.GetJson
    End Function
End Class
And creating this dictionary will make the input country name compatible with all fields in the ISO-3166_1 data. And then, by using this dictionary, we can translate the input keyword as the iso-3166-1 alpha2 code for finding the svg graphics or path object.
Public ReadOnly statDict As Dictionary(Of String, String)

statDict = (From x As ISO_3166
            In __iso_3166
            Select {
                x.name.ToLower,
                x.alpha2,
                x.alpha3,
                x.code}.Select(Function(code) New With {
                    .code = code,
                    .alpha2 = x.alpha2
                })).MatrixAsIterator.ToDictionary(
                    Function(x) x.code,
                    Function(x) x.alpha2)
So that by using the iso-3166 alpha2 code, we can find any country object in the map svg data by using the code below:
''' <summary>
''' thanks to the XML/HTML style of the SVG (and Nathan’s explanation) I can create CSS
''' classes per country
''' (the polygons of each country uses the alpha-2 country code as a class id)
''' </summary>
''' <param name="map"></param>
''' <param name="code"></param>
''' <returns></returns>
<Extension>
Private Function __country(map As SVGXml, code As String) As node
    Dim alpha2 As String =
        If(statDict.ContainsKey(code),
        statDict(code),
        statDict.TryGetValue(code.ToLower))
    Dim c As node = map.gs.__country(alpha2)

    If c Is Nothing Then
        c = map.path.__country(alpha2)

        If c Is Nothing Then
            Call $"Unable found Object named '{code}'!".PrintException
        End If
    End If

    Return c
End Function

<Extension>
Private Function __country(subs As path(), alpha2 As String) As path
    For Each path As path In subs.SafeQuery
        If path.id.TextEquals(alpha2) Then
            Return path
        End If
    Next

    Return Nothing
End Function

<Extension>
Private Function __country(subs As g(), alpha2 As String) As node
    Dim state As New Value(Of node)

    For Each c As g In subs
        If alpha2.TextEquals(c.id) Then
            Return c
        Else
            If c.gs.IsNullOrEmpty Then
                Continue For
            End If
        End If

        If Not (state = c.gs.__country(alpha2)) Is Nothing Then
            Return state
        End If

        If Not (state = c.path.__country(alpha2)) Is Nothing Then
            Return state  ' fix error for GF island
        End If
    Next

    Return Nothing
End Function
Level Mappings
By measuring the difference of value x with the minimum value of the vector elements, and then calculating the proportion by dividing the difference with the extreme distance of the max and min value in the input vector, we can do a linear scale mapping of the input data:
For Each x As Double In array
    Dim lv As Integer = CInt(Level * (x - MinValue) / d)
    chunkBuf(++i) = lv + offset
Next
Here is the linear mapping function that is defined in VisualBasic: Microsoft.VisualBasic.Mathematical::ScaleMaps.GenerateMapping(System.Collections.Generic.IEnumerable(Of Double), Integer, Integer) As Integer()
''' <summary>
''' Linear mappings the vector elements in to another scale within specific range from
''' parameter <paramref name="Level"></paramref>.
''' </summary>
''' <param name="data">Your input numeric vector.</param>
''' <param name="Level">The scaler range.</param>
''' <returns></returns>
''' <param name="offset">
''' The default scaler range output is [1, <paramref name="Level"></paramref>],
''' but you can modify this parameter value for moving the range to
''' [<paramref name="offset"></paramref>, <paramref name="Level"></paramref> +
''' <paramref name="offset"></paramref>].
''' </param>
<ExportAPI("Ranks.Mapping")>
<Extension> Public Function GenerateMapping(data As IEnumerable(Of Double), _
            Optional Level As Integer = 10, Optional offset As Integer = 1) As Integer()
    Dim array As Double() = data.ToArray
    Dim MinValue As Double = array.Min
    Dim MaxValue As Double = array.Max
    Dim d As Double = MaxValue - MinValue

    If d = 0R Then
        Return 1.CopyVector(array.Length)
    End If

    Dim chunkBuf As Integer() = New Integer(array.Length - 1) {}
    Dim i As int = 0

    For Each x As Double In array
        Dim lv As Integer = CInt(Level * (x - MinValue) / d)
        chunkBuf(++i) = lv + offset
    Next

    Return chunkBuf
End Function
Generates the Color Patterns

The color maps in this tools have eight patterns, which can be assigned from the renderer function's mapName parameter:
''' <summary>
''' Spring
''' </summary>
Public Const PatternSpring As String = "Spring"
''' <summary>
''' Summer
''' </summary>
Public Const PatternSummer As String = "Summer"
''' <summary>
''' Autumn
''' </summary>
Public Const PatternAutumn As String = "Autumn"
''' <summary>
''' Winter
''' </summary>
Public Const PatternWinter As String = "Winter"
''' <summary>
''' Jet
''' </summary>
Public Const PatternJet As String = "Jet"
''' <summary>
''' Gray
''' </summary>
Public Const PatternGray As String = "Gray"
''' <summary>
''' Hot
''' </summary>
Public Const PatternHot As String = "Hot"
''' <summary>
''' Cool
''' </summary>
Public Const PatternCool As String = "Cool"
The color pattern generated code can be found at this CodeProject article:
Quote:"Create Custom Color Maps in C#": http://www.codeproject.com/Articles/18150/Create-Custom-Color-Maps-in-C
And also additional three color patterns are provides from this R script result, and the render function using this R generated color pattern with 256 mapping level depth:
require(fields)

# Loading required package: fields
# Loading required package: spam
# Loading required package: grid
# Spam version 1.3-0 (2015-10-24) is loaded.
# Type 'help( Spam)' or 'demo( spam)' for a short introduction
# and overview of this package.
# Help for individual functions is also obtained by adding the
# suffix '.spam' to the function name, e.g. 'help( chol.spam)'.
#
# Attaching package: ‘spam’
#
# The following objects are masked from ‘package:base’:
#
#     backsolve, forwardsolve
#
# Loading required package: maps
#
#   maps v3.1: updated 'world': all lakes moved to separate new #
#   'lakes' database. Type '?world' or 'news(package="maps")'.  #

designer.colors(n=10, col=c("#CCEBC5", "#A8DDB5", "#7BCCC4", "#4EB3D3", "#08589E", "#08589E"))
designer.colors(n=256, col=c("#CCEBC5", "#A8DDB5", "#7BCCC4", "#4EB3D3", "#08589E", "#08589E"))
designer.colors(n=512, col=c("#CCEBC5", "#A8DDB5", "#7BCCC4", "#4EB3D3", "#08589E", "#08589E"))
Fill Color on Polygon
As we've described above, all of the graphics and path object in the SVG image have an attribute for applied the CSS style which is named style, so that we just assign the CSS fill style into this attribute that we can fill the specific color into the target polygon object. Here is the code:
<Extension> Public Sub FillColor(ByRef g As node, color As String)
    g.style = $"fill: {color};"  ' path/g

    If TypeOf g Is g Then
        Dim x As g = DirectCast(g, g)

        For Each [sub] As g In x.gs.SafeQuery
            Call [sub].FillColor(color)
        Next

        For Each path As path In x.path.SafeQuery
            path.style = g.style
        Next
    End If
End Sub
Insert Image into SVG

Finally, we can render the map with various colors, and we need a legend to indicate the meaning of these colors. Drawing a legend by using gdi+ is super easy and embedding this generated legend image into the Svg image is also easy. About how to embed the image into SVG, please review this stackoverflow problem.
Here is the svg image object that is defined in Visual Basic:
Public Class Image

    <XmlAttribute> Public Property x As Double
    <XmlAttribute> Public Property y As Double
    <XmlAttribute> Public Property width As String
    <XmlAttribute> Public Property height As String
    <XmlAttribute("image.data")> Public Property data As String

    ''' <summary>
    ''' ``data:image/png;base64,...``
    ''' </summary>
    Const base64Header As String = "data:image/png;base64,"

    Sub New()
    End Sub

    Sub New(image As Bitmap, Optional size As Size = Nothing)
        data = base64Header & image.ToBase64String
        If size.IsEmpty Then
            size = image.Size
        End If
        width = size.Width
        height = size.Height
    End Sub
End Class
And after the legend image was output from the DrawLegend function, we can create a svg image object and put on the specific position on the svg Image by calculating the x and y position value.
legend = designer.DrawLegend(title)
renderedMap.images = {
    New SVG.Image(legend) With {
        .height = legend.Height * 0.5,
        .width = legend.Width * 0.5,
        .x = .width / 2,
        .y = renderedMap.height - .height
    }
}
Example
A demo CLI tools for this map color rendering module can be found in the attachments.
CLI tool
<ExportAPI("/Rendering",
           Usage:="/Rendering /in <data.csv> [/main <title>
           /legend.title <legend title> /map.levels <512> /map <map.svg>
           /map.Name <default> /out <out.svg>]")>
<ParameterInfo("/in", False,
               AcceptTypes:={GetType(Data)},
               Description:="A data file template example can be found in the
                             ./Templates/ folder.")>
<ParameterInfo("/map.levels", True, AcceptTypes:={GetType(Integer)},
               Description:="Any positive integer value,
                             this will adjust the color depth for the value mappings.")>
<ParameterInfo("/map", True,
               Description:="User custom map svg,
                             please note that the id attribute of the ``g`` or
                             ``path`` object in the svg stands for the country
                             for region should be the iso-3166-1 alpha2 code.")>
<ParameterInfo("/map.Name", True, AcceptTypes:={GetType(String)},
               Description:="The color map pattern profile name,
                             the VisualBasic language build in color patterns name
                             can be found at github:
                          https://github.com/xieguigang/VisualBasic_AppFramework/tree/master/gr
               And this value is set as ``default`` if this parameter is not specified,
               in this situation,
               the parameter value of /map.levels is only allowed 256 or 512.")>
Public Function Rendering(args As CommandLine) As Integer
    Dim [in] As String = args("/in")
    Dim map As String = args("/map")
    Dim iso_3166 As String = args("/iso_3166")
    Dim levels As Integer = args.GetValue("/map.levels", 512)
    Dim mapName As String = args.GetValue("/map.Name", "default")
    Dim main As String = args("/main")
    Dim out As String = args.GetValue(
        "/out",
        [in].TrimSuffix & $".rendering;levels={levels},map.Name={mapName}.svg")
    Dim data As IEnumerable(Of Data) = [in].LoadCsv(Of Data)
    Dim legend As Bitmap = Nothing
    Dim legendTitle As String = args.GetValue("/legend.title", "Legend title")
    Dim svg As SVGXml = data.Rendering(
        levels,
        mapTemplate:=map.ReadAllText(throwEx:=False, suppress:=True),
        mapName:=mapName,
        legend:=legend,
        title:=legendTitle)
    If Not String.IsNullOrEmpty(main) Then
        svg.title = main
    End If
    Return svg.SaveAsXml(out).CLICode
End Function
CLI usage
GIS_render /Rendering /in <data.csv> [/main <title> /legend.title <legend title>
/map.levels <512> /map <map.svg> /iso_3166 <iso_3166.csv> /map.Name <default> /out <out.svg>]
Gallery
Test Data: Life expectancy at birth, male (years)
API_SP.DYN.LE00.MA.IN_DS2_en_csv_v2 data was download from worldbank: http://data.worldbank.org/indicator/SP.DYN.LE00.MA.IN using year 2012 as Data.value.
#!/bin/bash

../GIS_render.exe /rendering /in ./API_SP.DYN.LE00.MA.IN_DS2.csv /map.name Summer /map.levels 512
../GIS_render.exe /rendering /in ./API_SP.DYN.LE00.MA.IN_DS2.csv /map.name Jet /map.levels 20
Test Rendering with /map.levels = 512; /map.Name = Summer

Test Rendering with /map.levels = 20; /map.Name = Jet

Test on Linux
The example CLI tools have been test successful on Ubuntu system:

History
- 26th September, 2016: Initial version