Introduction
In my experience so far, I have seen many programmers not utilizing the available tools and techniques effectively. It is observed that most developers spend more time in testing and debugging code in comparison to developing code. Thus by saving even a small amount of time here will result in big savings overall. This saved time can then be utilized in a better way for something else.
Background
In this article we will showing steps on how to setup a remote debugging environment to improve security and productivity. These information are available on Internet but scattered around and difficult to fina via search engines. I faced these difficulties in the past and thought of writing an article to explain this setup process at one place and in easy way.
Since we are talking about remote debugging we will generally set this up on a machine different from the development machine. This article uses a Hyper-V VM to help explain the setup process.
Setting Up Remote Machine
The Microsoft Remote Debugging Page provides explaination on how to setup the remote debugger on a remote machine such as the VM. Reproduced below for easy reference:
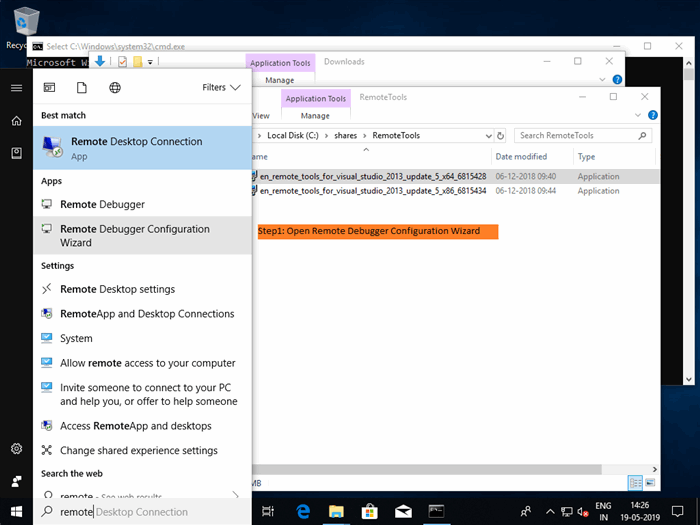
If you want to configure the remote debugger as a service, follow these steps.
-
Find the Remote Debugger Configuration Wizard (rdbgwiz.exe). (This is a separate application from the Remote Debugger.) It is available only when you install the remote tools. It is not installed with Visual Studio.
-
Start running the configuration wizard. When the first page comes up, click Next.
-
Check the Run the Visual Studio 2015 Remote Debugger as a service checkbox.
-
Add the name of the user account and password.
You may need to add the Log on as a service user right to this account (Find Local Security Policy (secpol.msc) in the Start page or window (or type secpol at a command prompt). When the window appears, double-click User Rights Assignment, then find Log on as a service in the right pane. Double-click it. Add the user account to the Properties window and click OK). Click Next.
-
Select the type of network that you want the remote tools to communicate with. At least one network type must be selected. If the computers are connected through a domain, you should choose the first item. If the computers are connected through a workgroup or homegroup, you should choose the second or third items. Click Next.
-
If the service can be started, you will see You have successfully completed the Visual Studio Remote Debugger Configuration Wizard. If the service cannot be started, you will see Failed to complete the Visual Studio Remote Debugger Configuration Wizard. The page also gives some tips to follow to get the service to start.
-
Click Finish.
At this point the remote debugger is running as a service. You can verify this by going to Control Panel > Services and looking for Visual Studio 2015 Remote Debugger.
You can stop and start the remote debugger service from Control Panel > Services.
Steps via Images

Setting up account for authenticating debugger service
Explanation of point 4 above. If the secpol.msc is missing then install using one of the below mthods until one of them works:
1. Install group policy management console from here
2. Or Follow the instructions here to install group policy client services package.
Once policy management console is installed and/or available follow point 4 above in previous section to give the user "log on as a service" right as shown in below pictures.
Steps via Images
Using Local Machine For Debugging
Once the remote debugger is setup and running as a service, you can connect to it using your IDE on local machine for seamless debugging.
If you want to securely connect to the remote debugger which is running as a service, then follow these steps:
Attaching to process:
1. In your visual studio IDE open Debug menu -> Attach to Process
2. Leave the connection type as "Default"
3. Change the connection target to "<Remote IP Address>:<Remote Port>" and press "Enter"
4. Authenticate using the same username and password that was used to start the remote debugger as a service.
Authentication is a one time activity.
5. Choose the process to be debugged and start debugging.
Optionally choose show process from all users to see the process of your interest.
History
First post.
This member has not yet provided a Biography. Assume it's interesting and varied, and probably something to do with programming.


