DubuggerHidden attribute tells the Visual Studio debugger that the method is hidden from the debugging process and while debugging. This is quite helpful when you don't want to go to stepping inside of a method while debugging.
When you mark a method with DebuggerHidden() attributes, it explicitly tells the debugger not to step inside of that method and no break point will be hit over that method. Now I am going to explain the same using an example with Intellitrace debugging.

Let’s consider you have the below code snippet:
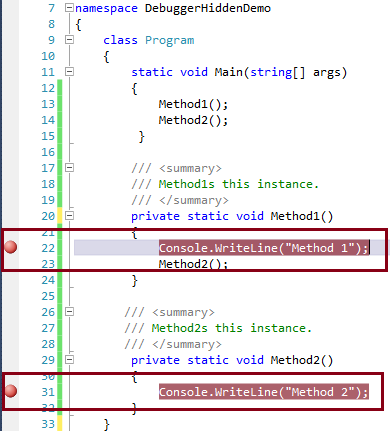
We have set two break points in each of the methods (Line 22, and Line 31 as shown). Now if you run this application and check the output intellitrace debugging window, you will get the below output:

As per the above image, you can see the flow of the application from Main() > Method1() > Method2(). If you also check the current live event’s “Call Stack”, that also represents the call of method2() from method1(). This is as per our expected behavior.
Now, if you don’t need to go inside Method1() while debugging and debugger should not stop inside method1() for any of the breakpoints, you have to add “DebuggerHidden()” attributes with the method1(). If you try to debug the application with the same breakpoint, CallStack() and IntelliTrace debugger view will be something different.

If you check the above image, the debugger reached Method2() through Method1(), but breakpoint in method1() never hits, because of the “DebuggerHidden” attribute.
If you move from “EventView” mode to “CallView” mode in Intellitrace window, you can find the actual flow of sequence of the program.

Summary
In this blog post, I have explained how we can hide a method from debugger to step in using “DebuggerHidden” attribute.
Hope this will help you.
My Other Articles on Debugging
Filed under:
General,
Tips and Tricks,
Visual Studio 2010 


 General
  News
News  Suggestion
  Question
  Bug
Bug  Answer
  Joke
Joke  Praise
  Rant
Rant  Admin
Admin 


![Rose | [Rose]](https://codeproject.global.ssl.fastly.net/script/Forums/Images/rose.gif) from me...
from me...