Introduction
It's Friday afternoon, everything seems to be all right. No outstanding issues in your queue and you start thinking about that happy hour with your coworkers... Then out of nowhere, you get a call from a customer claiming that your app is consuming up to 100% of the server's CPU and it is not letting it go. The only solution available so far is to restart your app altogether.
First thought: "Impossible! I've tested it all, so the QA team!”
Second one: "It must be some other service in their environment causing that!".
And the denial circle goes on and on, and you find yourself trapped at your desk until late night, trying to solve this mystery.
All right, let's put the drama aside (although such a trouble seems to be more frequent on Friday evenings...).
The fact is, when there is an unjustified resource consumption and you can't reproduce it in any local test environment, things can get complicated.
Background
I’ve found it really difficult to get any article tackling this subject completely, end to end. Actually, that was my whole motivation to write down these steps here, then everyone can save some precious beer time.
Any previous knowledge isn't really required as the following steps are, pretty much, a compilation of all material I was able to gather in this particular episode.
Let's get to work!
Step 1: Downloading the Debug Toolkit
First thing that you want to do is to get the WinDbg:
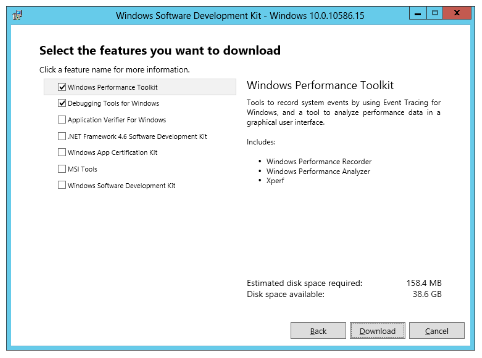
Step 2: What to Install
This is a nice catch as you definitely don't need the whole heavy package to be installed. You only need two items:

Step 3: Collecting Dump File
After installing the package, open the task manager, then right click on your busiest process to create the dump file:

When it is done processing, you will see the confirmation message below (take note of this path, you will need it later on):

Step 4: Picking the Right Debugger
Now is the time to use the debug tool. You will need to run the executable according to your operating system, this is critical to get the whole thing working. The installer places two debug kits at your disk:

Path: C:\Program Files (x86)\Windows Kits\10\Debuggers\x64

Path: C:\Program Files (x86)\Windows Kits\10\Debuggers\x86
I'm running this ASP.NET application in a Windows 64 environment, therefore my demonstration is based on the first .exe above (X64).
Step 5: Using the Debugger
By executing the Windbg.exe file as an administrator, this IDE will be shown:

Under the File menu, click on the Open Crash Dump... option and select the dump file you have created in step number 3:

Then, it will display a command window like this:

Note: This green area I've highlighted is the prompt where we will be firing some commands in order to analyse the dump file.
Step 6: Loading the Live Debugging
In the prompt highlighted above, type .cordll -ve -u -l and press enter. The output should be similar to:
Loading unloaded module list
................................................................
ntdll!NtWaitForSingleObject+0xa:
000007f8`50482c6a c3              ret
0:000 .cordll -ve -u -l
Automatically loaded SOS Extension
CLRDLL: Loaded DLL C:\Windows\Microsoft.NET\Framework64\v4.0.30319\mscordacwks.dll
CLR DLL status: Loaded DLL C:\Windows\Microsoft.NET\Framework64\v4.0.30319\mscordacwks.dll
Quoting Microsoft oficial source:
Quote:
"Loading mscordacwks.dll and sos.dll (live debugging)
Assume that the debugger and the application being debugged are running on the same computer. Then the .NET Framework being used by the application is installed on the computer and is available to the debugger.
The debugger must load a version of the DAC that is the same as the version of the CLR that the managed-code application is using. The bitness (32-bit or 64-bit) must also match. The DAC (mscordacwks.dll) comes with the .NET Framework. To load the correct version of the DAC, attach the debugger to the managed-code application, and enter this command."
Note: If something went wrong here, double check if you are using the correct debugger version (x64 or x86), according to the Windows version.
Step 7: Analysis Command
Now, type ~* e !clrstack and press enter.
The result here heavily depends on your scenario, however the dump file I was analyzing gave away this useful piece of information:
OS Thread Id: 0x14b2c (34)
        Child SP               IP Call Site
000000d4675ba6a0 000007f83603076c System.Collections.Generic.Dictionary`2
[[System.__Canon, mscorlib],[System.Int32, mscorlib]].Insert
 (System.__Canon, Int32, Boolean)

000000d4675ba730 000007f7ef967c9e MyApp.Customers.AddNewCustomer(Customer)
000000d4675ba8f0 000007f7ef967413 MyApp.Customers.Add(Customer)
000000d4675ba930 000007f7efa49223 MyApp.Customers.Add
(System.String, MyApp.Operator, System.String, MyApp.Operator, System.String)
000000d4675ba9c0 000007f7efa48acf MyApp.MyProcess.GetList
 (System.String, System.String,MyCollection)
000000d4675babf0 000007f7efa4755a MyApp.MyProcess.BuildList
(System.String, System.String, System.String,MyCollection)
000000d4675bae90 000007f7efa463e0 MyApp.MyProcess.AppendList
(System.Collections.Generic.IEnumerable`1, System.Text.StringBuilder,MyCollection)
000000d4675bb7d0 000007f7efa41ace MyApp.MyProcess.ParseFunction
(Ranet.Olap.Mdx.MdxFunctionExpression)
000000d4675bb890 000007f7efa41741 MyApp.MyProcess.ParseRootExpression
(Ranet.Olap.Mdx.MdxExpression)
I know, it doesn't look like much at first sight, but it indeed helped me. The problem here was:
The thread was getting stuck in the Insert method of the .NET Dictionary Insert(System.__Canon, Int32, Boolean) due the fact that my method .AddNewCustomer(Customer) was calling another method from a static class that, in turn, was using the same custom collection Customers.
Summarizing, the threads were going nuts in this method. No wonder.
By refactoring this method using a thread safe collection and properly synchronizing (lock) the classes involved, the problem was solved.
Conclusion
There is no limit about how troubleshooting an error can be dificult, especially when it's nearly impossible to reproduce the issue in your dev environment. Such a situation just leave us clueless.
This tip shows only a tiny fraction of what these Microsoft debug tools are able to do, but I hope this helps you fix your own mysterious bug or, at the very least, place you in the right direction to get it done.
Cheers!
