Click here to Skip to main content
15,882,163 members
Everything / General Programming / Debugging

Debugging

debugging

Great Reads

by PJ Arends
Trace your function calls to the Output window.
by Giovanni Scerra
Patterns to prevent null reference exceptions
by Maxim Kartavenkov
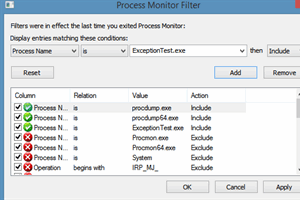
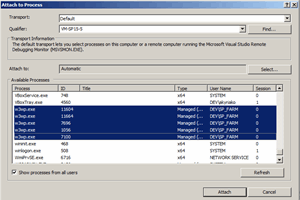
The series of articles covers most aspects of logging and tracing mechanisms which can be embedded into your application. It discusses simple ways of tracing and also new tracing technologies which were involved in Windows 10.
by David A. Gray
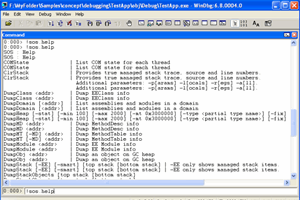
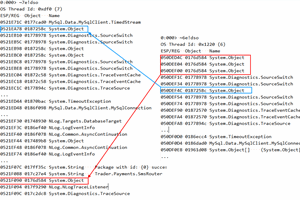
Historically, ETW has been portrayed as having a very steep learning curve, along the lines of the effort required to summit Everest. Realizing its potential value, I set about to reduce the effort to that required to summit Pike's Peak.

Latest Articles

by PJ Arends
Trace your function calls to the Output window.
by Maxim Kartavenkov
Discussion of how to organize saving application trace helper information.
by Maxim Kartavenkov
Continue discussion of the simple kernel drivers tracing mechanisms by using output information into the handles of the files pipes and console passed to the driver from the host application.
by Maxim Kartavenkov
Discussion of simple ways of tracing and also new tracing technologies involved in Windows 10

All Articles

Sort by Score

Debugging 

4 Sep 2014 by Ben M Watson
Learn how to use the debugger to answer implementation questions for yourself
10 Dec 2011 by Sebastian Solnica
PDB files out of the debugger
30 Jul 2014 by Sebastian Solnica
How you may noninvasively trace .NET applications with sysinternals tools
2 Dec 2014 by Sebastian Solnica
How to debug Windows services written in .NET
22 Apr 2015 by Bartlomiej Filipek
PDB Was Not Found - Linker Warning
6 Jan 2022 by Bernhard Nebel
Link-time optimization and debugging OO programs do not work very well together, at least on AVR MCUs.
29 Jun 2014 by Kyriakos Akriotis
SharePoint Debugging Assistant (free Visual Studio 2012/2013 add-in)
24 Jan 2020 by 10xlearner
Bug fixes and defensive programming
9 Sep 2016 by matt warren
If you’ve ever spent time debugging .NET memory dumps in WinDBG, you will be familiar with the commands shown below, which aren’t always the most straight-forward to work with!
27 Feb 2020 by Lukasz Szyrmer
Story points defined, disclaimers and example provided
27 Sep 2010 by Abhijit Jana
In this blog post I am going to explain how you can customize the complete view of the debugging window during debugging of application. By complete view means, where you can add own Properties, can customize the result, manipulate the data, hide properties which may not need during debugging etc. I
27 Dec 2012 by Karl Stoney
This .NET Tutorial explains how to set up and configure ELMAH (Error Logging Modules and Handlers) in an .NET 4.5 MVC 4 application
2 Sep 2015 by Sebastian Solnica
Today I would like to share with you an interesting (I hope) diagnostics case in one of our system services. The IngestService (that is its name) was not starting properly for the first time – it was being killed because of exceeding the default 30s timeout.
16 Mar 2015 by Sander Rossel
The last in a series on web development.
22 May 2017 by Kamran Bilgrami
A quick tip on how the new Exception Helper feature in Visual Studio 2017 can make your debugging experience a little quicker.
30 Apr 2015 by Sebastian Solnica
A case of a deadlock in a .NET application
29 Sep 2014 by Ronnie Mukherjee
How can the Pareto principle help us to produce better software
16 Dec 2017 by Biswal Tanmaya
This blog post discusses the importance of logging in MySQL
29 Dec 2013 by Sebastian Solnica
In this post, I will present you my MDbg plugin (includes a command: inject) that adopts the funceval API and an example diagnostics case in which I used it.
24 May 2011 by Naveen
In this post, we will see how the DumpViewer is able to open a particular file in Visual Studio and highlight the specified line.