Click here to Skip to main content
15,881,852 members
Everything / Chart

Chart

chart

Great Reads

by Bharat Mallapur
Sample project to host MS-Chart in your WPF application
by Sunasara Imdadhusen
MS Test Result Viewer is a free open source library to convert MS Test result (.trx) file into HTML. It is also allowed you to perform MS Test on your test container project (.dll) file. This utility will work with simple command line arguments to generate test report in HTML format with excellent U
by Angelo Cresta
.NET 5 version of dotnet/winforms-datavisualization
by Xavier John
Candlestick

Latest Articles

by Code Artist
Implementation of DynamicX-Largest-Triangle-Three-Bucket for chart data plotting
by Vishwas_R
Simple Audio Player to browse any song with Play / Pause, Stop options & a waveform generated using CanvasJS charts
by Vishwas_R
Create Angular dynamic chart with few simple steps using CanvasJS. Dynamic charts are also referred to as real-time chart / live chart.
by Angelo Cresta
.NET 5 version of dotnet/winforms-datavisualization

All Articles

Sort by Score

Chart 

2 Jul 2015 by Bharat Mallapur
Sample project to host MS-Chart in your WPF application
16 Oct 2012 by Sunasara Imdadhusen
MS Test Result Viewer is a free open source library to convert MS Test result (.trx) file into HTML. It is also allowed you to perform MS Test on your test container project (.dll) file. This utility will work with simple command line arguments to generate test report in HTML format with excellent U
22 Apr 2021 by Angelo Cresta
.NET 5 version of dotnet/winforms-datavisualization
4 Dec 2011 by Xavier John
Candlestick
12 Feb 2013 by V.
How to dynamically build a JQPlot graph through the code behind.
6 Nov 2013 by Sichen D
How to build system availability timeline in SSRS
28 May 2015 by Mostafa Asaduzzaman
How to create a quick pie graph using MVC Model and CanvasJS
21 Oct 2023 by Code Artist
Implementation of DynamicX-Largest-Triangle-Three-Bucket for chart data plotting
23 Dec 2011 by RaviRanjanKr
Try Bezier curve for the Microsoft Web Chart control[^]
3 Apr 2012 by Maciej Los
Try to use ROUND()[^] function.Example:SELECT 1.23 [Value], ROUND(1.23,1) AS [RndValue]UNION ALLSELECT 1.24 [Value], ROUND(1.24,1) AS [RndValue]UNION ALLSELECT 1.25 [Value], ROUND(1.25,1) AS [RndValue]UNION ALLSELECT 1.26 [Value], ROUND(1.26,1) AS [RndValue]UNION ALLSELECT...
16 Feb 2012 by Shahin Khorshidnia
Hi, Suppose that there is a line between (1,9) and (2,10)Mathematical:Y - y1 = (X - x1)(y2 - y1)/(x2 - x1)Y - 9 = (X - 1)(10 - 9)/(2 - 1)Y = X + 8If X = 1.5 Then Y = 1.5 + 8 = 9.5C# Code:private double ComputeY(Point[] points, double x) { ...
8 Mar 2012 by Aaron Pate
I was just wondering, Is there a way I could display data from a serial port on a chart in real time, if not by just refreshing the web page?Basically I have a radio receiver hooked up to my computer by a serial port. I need to get the data so i can plot a chart that will show the frequency...
29 Mar 2012 by Sebastian T Xavier
Your code seems to be incomplete....please use between for better date comparisons...Regards
14 May 2012 by hairy_hats
Found it, you have to turn the ChartArea.InnerPlotPosition from Auto to Manual.
28 May 2012 by taha bahraminezhad Jooneghani
you can use Chart.DataBindTable method like this:Chart1.DataBindTable(myReader, "SalesName");all things about chart binding is here:http://blogs.msdn.com/b/alexgor/archive/2009/02/21/data-binding-ms-chart-control.aspx[^]
21 Jun 2012 by Prasad_Kulkarni
Refer:Creati...
15 Jul 2012 by Douglas Smallish
Demonstrates how to code a Silverlight Chart ControlTemplate Programmatically.
21 Aug 2012 by pramod.hegde
Chart Control adjusts the chart area heights itself. ChartArea does not posses Height property to set the height.http://msdn.microsoft.com/en-us/library/dd456621.aspxSo alternate way to achieve it is to have 2 different Chart objects.
7 Mar 2013 by Jegan Thiyagesan
Hi,Have you tried the ".Update()"?it will be something like chart1.Update();Jegan[Edit]chart1.UpDate(); changed into chart1.Update(); (C# is case-sensitive)[/Edit]
3 Aug 2013 by André Kraak
You have duplicates because the orderPeriod field is in the SELECT statement.Remove this field from both the SELECT and GROUP BY and you should get a total for each product without duplicates.SELECT DISTINCT productName, SUM(quantity) AS Expr1 FROM WP_analytic WHERE (orderPeriod >=...
16 May 2014 by ZurdoDev
It could be a couple of issues which is what SA was getting at.See http://stackoverflow.com/questions/420659/unicode-characters-not-showing-in-system-windows-forms-textbox[^]The textbox does support Unicode but it may be the font you are using or it may be that the font you need is not...
20 Oct 2015 by Ravi Bhavnani
> What happen?You attempted to modify a collection while enumerating (iterating) through it. That's not permitted./ravi
21 Feb 2017 by Bryian Tan
Will this help if you change this lineTOThe reason I recommend that changes because, I'm using that chart control also...
28 May 2020 by phil.o
It all depends on what you mean by 'not working'. Maybe you just need to treat Y values as double, instead of string? foreach (DataRow r in initialDataSource.Rows) { series.Points.AddXY("Actual", double.Parse(r["Actual"].ToString())); ...
4 Aug 2022 by Vishwas_R
Simple Audio Player to browse any song with Play / Pause, Stop options & a waveform generated using CanvasJS charts
17 Dec 2022 by Graeme_Grant
LiveCharts - LiveCharts2[^] is very simple to use. The documentation is very good with code samples given. From their documentation, ref: samples.bars.withBackground - LiveCharts2[^] 1. ViewModel using CommunityToolkit.Mvvm.ComponentModel;...
30 Jul 2023 by Graeme_Grant
Best place to ask is here: Issues · beto-rodriguez/LiveCharts2 · GitHub[^] or here: Questions tagged [livecharts] - StackOverflow[^] But... looking at the documentation I found this: CartesianChart.Column series props - LiveCharts2[^] which...
14 May 2010 by Maximilien
Your question is not clear; What do you mean by:Druks wrote:so that the pie chart will be drawn from a file or even a dialogAre you meaning you want to get the data from a file or some user input from a dialog ?Do the different article and sample of Pie Charts posted on CodeProject...
11 Aug 2010 by E.F. Nijboer
Time to go back to the thread basics...http://www.albahari.com/threading/part2.aspx[^]Look for: Rich Client Applications and Thread AffinityYou need to synchronize your calls to the UI thread using invoke or otherwise you'll get that error. Good luck!
16 Feb 2011 by JF2015
You can use the MS Chart control:http://www.microsoft.com/downloads/en/details.aspx?FamilyId=130F7986-BF49-4FE5-9CA8-910AE6EA442C&displaylang=en[^]or the ZedGraph control from CP:A flexible charting library for .NET[^]
2 Jun 2011 by R. Hoffmann
Hi guys,Apologies in advance for the long post!I have to change the colours of the slices in a pie chart to automatic, using COM automation. In other words, I need to programmatically achieve the same as if I had right-clicked a pie chart in Excel (2007), selected "Format Data...
2 Jun 2011 by Maciej Los
In your example, you need to ClearFormats for ChartArea and then set ChartType and other options:In Excel VBA:Option ExplicitSub SetAutoSlices()Dim chrt As Chart, chrtA As ChartArea, chrtG As ChartGroupDim wsh As WorksheetOn Error GoTo Err_SetAutoSlicesSet wsh =...
2 Jun 2011 by Ruard
This should work:dataSeries.Interior.ColorIndex = XlColorIndex.xlColorIndexAutomatic
23 Jun 2011 by Pete O'Hanlon
Right - I've had a look at your code. The issue you're facing here is that you are doing everything on the UI thread - and you shouldn't do that. What I did was create a BackgroundWorker in which I read the data in and updated the ObservableCollection. I then marshalled the data back onto the UI...
25 Jul 2011 by #realJSOP
Why don't you ask these questions on ComponentOne's own forums?
27 Jul 2011 by Dave Kreskowiak
Never heard of it.Your best source of information on that library is going to be the people who wrote it and put up forums dedicated to using their products. I know it probably seems to logical to be true, but click here[^] for the forums at VisiFires site.
30 Aug 2011 by joe_j
Hi,I would want to create a webpage with updatepanels showing 12 charts in each page.The data is pulled out from an access database which is linked to excel named ranges.Is this the right method and is it fine to show so many charts with a timer to change the update panels to the next...
9 Sep 2011 by Manish V Mahajan
Hi,The problem I has is follows:1. I have a DataGrid table with rows and columns bound to a List where the DataStructure has Name, MinVal, MaxVal, TodayVal.2. In my DataGrid, I need to display a chart/graph of all the data values for a list of data points. For...
9 Sep 2011 by Simon Bang Terkildsen
1) Y is down and that's just the way it is, you should be able to accommodate that easily, all you need to do when you've calculated Y is y = 0-y.2) You can use ScaleTransform[^] for this, there are examples at the bottom of the page.
6 Oct 2011 by virang_21
Add legends in your .aspx file. The charting control will take care of bar color for legends.
6 Oct 2011 by member60
try the following way:String connString = ConfigurationManager.ConnectionStrings["LocalSqlServer"].ToString(); String sSQL = "select distinct subject, marks FROM tblStudentMarks order by 2"; DataTable result = new DataTable(); using (SqlConnection conn = new...
6 Oct 2011 by koolprasad2003
Chart legend automatically selects color based on the color used in the series. You can only specify color for custom legend itemchart1.Series[0].Color = Color.Green;try to put your question in MSChart forum, Here[^].
6 Oct 2011 by raj ch
.BackColorTab { font-family:Verdana, Arial, Courier New; font-size: 10px; color:Gray; background-color:#CCCCFF; } ...
23 Dec 2011 by NandaKumer
check these blogshttp://www.scottlogic.co.uk/blog/colin/2010/11/adding-a-smoothed-line-series-bezier-curve-to-a-visiblox-chart/[^]http://blog.rainer.halanek.com/2011/03/bezier-curve-for-microsoft-web-chart.html[^]--NDK
1 Jan 2012 by Sergey Alexandrovich Kryukov
Where have you been? Even though 1256 charset would work in HTML page, it has been replaced with Unicode, which can be used to support nearly all languages in one text. ASP.NET supports Unicode; using anything else would be quite awkward; I don't even want to discuss it.Now, do you mean...
5 Jan 2012 by Wayne Gaylard
Take a look at my article o the MSChart control A Guide to using MSChart for .NET[^] .Hope this helps
16 May 2012 by Pete O'Hanlon
You don't save the charts, you save the data that is used to make the charts. There's no need to save the actual chart because it is simply a visual representation of the data.
17 May 2012 by TorstenH.
Apache POI[^] is what you will need to do this.Apache POI-HSSF and POI-XSSF[^] are needed to work with Excel data.PLease check the menu on the left side of that webpage for more info (documentation, tutorial/examples etc.)
12 Jun 2012 by Sandeep Mewara
Have a look at these:MSDN: Microsoft Chart Controls...New ASP.NET Charting Control[^]Creating Line Chart For WebForms Using C#.[^]Understanding Chart Areas with Dundas Chart for .NET[^]Microsoft Chart with ASP.NET 3.5 – Part 1Microsoft Chart with ASP.NET 3.5 – Part 2
12 Jun 2012 by rohit_singhk
I re-solved MyselfASPX Code... ImageLocation="~/TempImages/ChartPic_#SEQ(300,3)" Width="950px" Height="541px" BorderDashStyle="Solid" BackGradientStyle="TopBottom" BorderWidth="2" BorderColor="181, 64, 1"> ...
22 Jul 2012 by StianSandberg
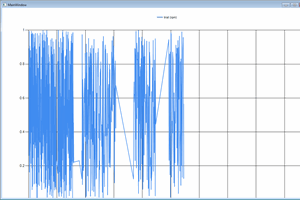
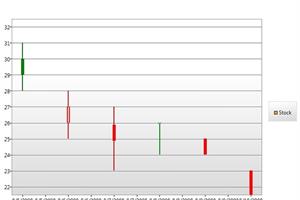
MS Chart control can be used in .NET 3.5 also. Microsoft Chart Controls for Microsoft .NET Framework 3.5[^]Before this chart control you had to use a 3rd party component like ComponentOne, Telerik, DevExpress etc.You can build charts manually using either javascript, flash, imaging etc, but...
26 Jul 2012 by codeBegin
Organization Chart Generator[^]Use Organization Chart Designer Sample[^]Generate an Organization Chart from Employee Database[^]
17 Aug 2012 by Prabhakaran Soundarapandian
Have a Look on the below linksLINK1LINK2LINK3LINK4LINK5
23 Aug 2012 by pramod.hegde
ChartSpace object is the main object in chart creation. Chart object and many properties to it are added later point of time.Whenever you are dealing with Office Open Xml please have Open XML SDK 2.0 Productivity Tool installed in your system. Create a chart in excel manually. Open up the...
3 Sep 2012 by Sandeep Mewara
Following articles should help:Gantt Chart[^]Using Gantt Chart Components[^]Try!
21 Feb 2013 by Sergey Alexandrovich Kryukov
Can I unsee it?! :-)Suppose you wanted to say if (checkbox1.checked == true) { /* ... */ } and mixed up '==' (check for equality) with '=' (assignment) and lost the upper-case in "Checked" ("checked" would not compile). It happens. But isn't it obvious that if (checkbox1.checked == true) {...
15 Mar 2013 by Zoltán Zörgő
Yu could start here: ASP.NET 4.0 Chart Control[^]
12 Jun 2013 by Ahmed Bensaid
ASP.NET 4.0 Chart Control[^]
28 Jul 2013 by Brady Kelly
I need to chart entries to a car park over time, in a line graph, with time of day as an X axis and number of entries on the Y axis. This is easy and I have achieved it with a simple sum query, grouped by Hour.What I need to do is have one line in the chart for each day of the week. I have...
11 Nov 2013 by Handyman83
I asked a question earlier on how to export a winform chart in C# to excel. I got some great suggestions and managed to do so. private void exportToExcel(string mR, string mM, string mD, string mS, Color mK, string mC) { string data = null; int i...
10 Jan 2014 by CPallini
No, you cannot use the chart control that way, as far as I know: you either draw yourself the map, using the GDI+ drawing primitives (or implementing your own char control, that in turn would use such graphical primitives) or use one of the available map controls (Google[^] and CodeProject[^]...
21 Jan 2014 by Dave Kreskowiak
I seriously doubt it's the Chart control doing that. It's been around for a long time and you're the only person to ever report such a behavior that I can find.Chances are far better that it's some kind of malware on the machine.
21 Jan 2014 by Ron Beyer
I use the chart control extensively and I do not have any problems on Windows 7 or Windows XP that causes all the files to disappear on the desktop.
4 Mar 2014 by Maciej Los
Have a look here: DateTime Structure[^]DateTime is always date and time of day. You should store date as a datetime data type, but you are able to display it in custom format: Custom Date and Time Format Strings[^].On SQL Server side, you can 'reject' time part, using CONVERT[^] function.
5 Mar 2014 by Pranav-BiTwiser
try this...var date_test = new Date("2011-07-14 11:23:00".replace(/-/g,"/"));
31 Mar 2014 by FarhanShariff
I have a DataTable as the following:new | Old | New_1| plot2.1 | 1.1 | 4.3 | 0.600.4 | 1.2 | 2.1 | 0.123.1 | 2.3 | 3.2 | 0.29I want to plot chart's with: 1new vs plot , Old vs plot, new_1 vs plot1 and save each of plots as images thus creating multiple chart images one...
12 May 2014 by Mehdi Gholam
Make sure you have created the C:\TempDump folder on your server and the asp.net worker process has access to it.
28 Aug 2014 by Gihan Liyanage
http://www.asp.net/web-pages/tutorials/data/7-displaying-data-in-a-chart[^]
7 Nov 2014 by Manas Bhardwaj
If I were you than instead of rebuilding, I would buy an existing component or reuse which is already available:And btw, why still Silverlight and not HTML5?Check these out:A WPF Custom Control for Zooming and...
24 Nov 2014 by Wastedtalent
To me this doesn't sound like you need 2 series on X, rather you need to concatenate the name and date into a single column in your query and then set that as your x series:string query = "select income, Cast(date as varchar) + ' ' + name from table user_pay";If you wanted to do display...
19 Feb 2015 by Ramza360
Here is the msdn info for the Chart Axis Axis[^]Then set chart1.ChartAreas["ChartArea1"].AxisY.Minimum = 80;chart1.ChartAreas["ChartArea1"].AxisY.Maximum = 90;This can also be done right from the properties window -> ChartAreas->Axes->Y (Value) Axis->Minimum / MaximumThere...
14 Apr 2015 by Sergey Alexandrovich Kryukov
You could find a lot of information on a good choice of charts libraries. See, for example:https://msdn.microsoft.com/en-us/magazine/dd453008.aspx[^],http://www.asp.net/web-pages/overview/data/7-displaying-data-in-a-chart[^],http://www.w3schools.com/aspnet/webpages_chart.asp[^].—SA
14 Apr 2015 by Maciej Los
If you want to get the count of users created each month of specified year, use://get distinct years and bind data to comboboxvar years = context.Profiles .Select(u=>u.CreatedOn.Year) .Distinct() .ToList();ComboBox1.DataSource =...
30 Apr 2015 by Richard MacCutchan
Sorry, but we do not do your college assignments for you.
8 Oct 2015 by Matt T Heffron
File is a poor choice to communicate between threads (BackgroundWorker).The System.Collections.Concurrent.BlockingCollection(Of T) is designed for exactly the type of inter-thread communication that you seem to need.If the file is just for the communication, then drop it entirely.
5 Nov 2015 by VR Karthikeyan
Hi, Use this in your code,chart1.Series[YourChartIndex].Points[Chart1_POINTINDEX].ToolTip = "Point Value";
27 Nov 2015 by OriginalGriff
Drop a Chart control on your form, and DataBind it to the same source as the DataGridView.Set the Series.XValueMember to the name of the property in your class you want along the X axis, and the Series.YValueMembers to the Y axis property.If you need to plot from two columns as one axis...
7 Jan 2016 by itsathere
I want to load multiple charts on every button click event.I have used below google code google.charts.load('current', { 'packages': ['corechart'] }); ...
27 Apr 2016 by Tadit Dash (ତଡିତ୍ କୁମାର ଦାଶ)
So do like this.$(document).ready(function () { LoadBankCashList(), LoadBankCashFlowBarChart(); $("[id*=drpbankcashflowchartpaytype], [id*=drpbankcashflowchartpayid], [id*=drpbankcashflowchartdaterange]").bind("change", function () { LoadBankCashFlowBarChart(); ...
31 Jul 2016 by Suvendu Shekhar Giri
Not sure if my suggestion will help you or not but check this for a try-You can embed the chart control in a div with fixed height (and width, if needed) and set the style as following as per your needoverflow: scroll; /* always shows both the scroll bars */overflow: auto; /* shows the...
7 Jan 2017 by OriginalGriff
I don't know what environment you are working in, but this is for WinForms:Highlight the Chart in your form.In the properties pane, Find the "CHart Areas" property, and use the ellipsis to open the properties dialog.In the Chart Area, select the "Axes" collection on the right hand side,...
14 Mar 2017 by Graeme_Grant
Not knowing the lib that you are referring to, but date values can be either localized or UTC (Universal Time).My guess is that you are passing a Localized server time where the lib is expecting a UTC time. Try converting to UTC before making the lib call.
18 Sep 2017 by Graeme_Grant
This link shows you how to do it correctly: Live Charts - WinForm Basic Line Chart sample with code[^]
8 Mar 2018 by CHill60
A good place to start is the documentation[^] The thing to consider is - are you genuinely interested in having this in a chart or is it just data - in which case there are all sorts of ways to do what you want
13 Jun 2018 by Ralf Meier
You stuck because the MSChart isn't able do do what you want to have. With the ChartArea\Area3DStyle you can tell the Chart that you like to have different (2D-) Series displayed behind each other - but that isn't the thing you want to have. For this you need another kind of Chart ... Here is a...
13 Jun 2018 by an0ther1
As per above comments. The issue was related to the database, in this case the Production server was using the wrong credentials. Changing the database connection string in the test environment to point to the production db assists with troubleshooting because it rules out the 2/3 of the...
16 Nov 2018 by CHill60
If you check the documentation - SqlDataReader.GetInt32(Int32) Method (System.Data.SqlClient) | Microsoft Docs[^] - it will show you Quote: public override int GetInt32 (int i); Parameters i Int32 The zero-based column ordinal. You are using a string in your code ......
26 Dec 2018 by OriginalGriff
Google is your friend: Be nice and visit him often. He can answer questions a lot more quickly than posting them here... A very quick search gave nearly half a million hits: simple pie chart c - Google Search[^] Including this Codeproject article: Create Pie Chart Using Graphics in C# .NET[^]...
10 Feb 2019 by Code Artist
MSChart Extension 2.2.0 Update with new features
26 Apr 2019 by MadMyche
Separation of Concerns comes into play here. The Chart is presentation layer and should be one of the last things to do; easiest way to do it would be via JavaScript on the actual webpage. PHP is server-side, and will play the roles of the Business Layer as well as the Data Layer. So how do...
26 Apr 2019 by Patrice T
Quote: How to create graph in PHP First of all, php is server side language, it is used to prepare page that will be sent to client browser. JS and html are client side. There is basically 3 ways to make a graph in an html page. - The canvas which is manipulated on client side by some JS code....
11 Jun 2021 by OriginalGriff
Try: string query = " SELECT DATENAME(MONTH, DATEADD(MONTH, MONTH(DateOfPurchase) - 1, '2001-01-01')) as Bulan, SUM(TotalPaid) AS JumlahJualan "; query += " FROM tblOrders GROUP BY MONTH(DateOfPurchase) ORDER BY MONTH(DateOfPurchase)";
14 May 2010 by Druks
I just created a program to draw a pie chart in MFC using dc.Pie(x1,x2,x3...). Now I have to add a file so that the pie chart will be drawn from a file or even a dialog. Please, I need some help.
26 May 2010 by YOGESH DHAGE
I just got the answer.chart.ChartAreas(strChartArea).AxisY2.LabelStyle.Format = "{0:0}%" :)
28 May 2010 by YOGESH DHAGE
Hi all,I am using chart control in .NET 3.5I want to read tha data values of Y-Axis through code in C#Anyone knows how to do this?ThanksYogesh
11 Aug 2010 by huynhdangthai
Hi Guys.I am building a project that draw a chart with real time using Microsoft Control Charts. Data source of chart changes every a few seconds to reload data. but i have got a trouble with it. The error is '{"Cross-thread operation not valid: Control...'I use thread job to start...
11 Sep 2010 by Anh Chu
Hi,Is there anyway to fill the area under a curve with gradient-by-value using Zedgraph? I know how to that with the symbol, bar, and segment line. But I could not do it with the are under the curve. I would like to have something like: Dark red (the color of the area under the curve) at 0,...
11 Sep 2010 by Abhinav S
Did you check on the Zedgraph forums? They might have an answer to your question.
12 Sep 2010 by Anh Chu
Zedgraph forum? Do you mean the Zedgraph Discussion in Zedgraph wiki??? If so, there is not an answer for this question. If not, please let me know where is the Zedgraph forum? I did google search and it showed only the Discussion talk in Zedgraph Wiki.Thank you