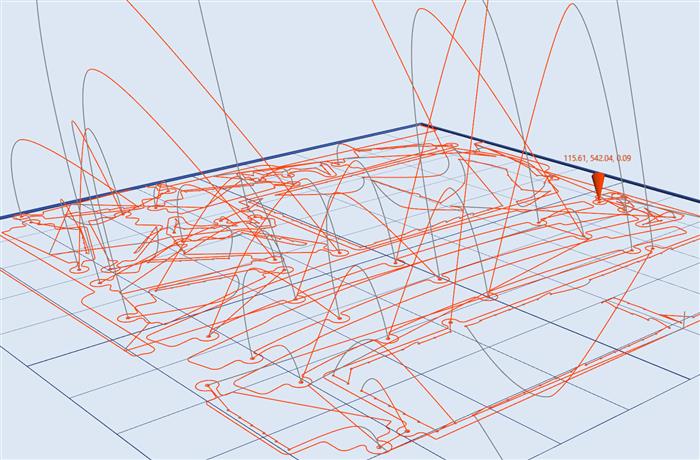
I have created a plot control based on the WPF Helix Toolkit for visualizing a real-time stream of 3D locations.
This control is being used to plot toolpath information for CNC and other industrial motion applications.
The companion project includes the source for the plot control plus a WPF demo app that generates a simple upward-spiraling trace. Copies of two Helix libraries "HelixToolkit.dll" and "HelixToolkit.Wpf.dll" must be located in the "HelixTraceDemoApp" directory before the project can be built. Alternatively, you can simply install the "HelixToolkit.Wpf" NuGet package.

Plot Control Features
- Axes, bounding box, grid and marker
- Trace is multi-color and variable line thickness
- Unnecessary points are pruned
- Demo app uses a worker thread to generate the trace
The Demo App
The WPF demo app is simply a main window that hosts a HelixPlot control and a Zoom button.
<local:HelixPlot x:Name="plot" ShowViewCube="False" />
A BackgroundWorker “gathers data” every 50 milliseconds, adds the data to a shared memory structure, and invokes the PlotData() method on the main UI thread. A List is used for data storage to avoid data loss if the worker thread is gathering data faster than it can be plotted.
private void GatherData(object sender, DoWorkEventArgs e)
{
while (true)
{
Thread.Sleep(50);
double x, y, z;
Color color;
var point = new Point3DPlus(new Point3D(x, y, z), color, 1.5);
bool invoke = false;
lock (points)
{
points.Add(point);
invoke = (points.Count == 1);
}
if (invoke)
Dispatcher.BeginInvoke(DispatcherPriority.Background, (Action)PlotData);
}
}
The PlotData() method reads and clears the shared memory structure and calls AddPoint() to plot the new data.
private void PlotData()
{
    if (points.Count == 1)
    {
        Point3DPlus point;
        lock (points)
        {
            point = points[0];
            points.Clear();
        }

        plot.AddPoint(point.point, point.color, point.thickness);
    }
    else
    {
        Point3DPlus[] pointsArray;
        lock (points)
        {
            pointsArray = points.ToArray();
            points.Clear();
        }

        foreach (Point3DPlus point in pointsArray)
            plot.AddPoint(point.point, point.color, point.thickness);
    }
}
The HelixPlot Class
The HelixPlot Class inherits from HelixViewport3D, adding specialized properties and methods for plotting a real-time 3D trace. Axis labels, bounding box size and other parameters are configured via a set of public properties.
public string AxisLabels { get; set; }
public Rect3D BoundingBox { get; set; }
public double TickSize { get; set; }
public double MinDistance { get; set; }
public int DecimalPlaces { get; set; }
public SolidColorBrush AxisBrush { get; set; }
public SolidColorBrush MarkerBrush { get; set; }
The CreateElements Method
Changes to the configuration properties have no effect until the CreateElements() method is called. However, the plot configuration can be modified on the fly without losing trace data. This method clears the plot control and constructs the axes, bounding box, grid and marker objects. If there is an existing trace, then it is restored.
The AddPoint Method
The plot control uses the Helix LinesVisual3D class to visualize the trace. In the simplest case, the AddPoint() method adds a line segment to the active LinesVisual3D object and advances the marker to the new location. However, a new LinesVisual3D object must be created if there is a change in color or line thickness. A new point that is less than a minimum distance from the current point will be ignored.
public void AddPoint(Point3D point, Color color, double thickness = -1)
{
if (trace == null)
{
NewTrace(point, color, (thickness > 0) ? thickness : 1);
return;
}
if ((point - point0).LengthSquared < minDistanceSquared) return;
if (path.Color != color || (thickness > 0 && path.Thickness != thickness))
{
if (thickness <= 0)
thickness = path.Thickness;
path = new LinesVisual3D();
path.Color = color;
path.Thickness = thickness;
trace.Add(path);
Children.Add(path);
}
bool sameDir = false;
var delta = new Vector3D(point.X - point0.X, point.Y - point0.Y, point.Z - point0.Z);
delta.Normalize();
if (path.Points.Count > 0)
{
double xp2 = Vector3D.CrossProduct(delta, delta0).LengthSquared;
sameDir = (xp2 < 0.0005);
}
if (sameDir)
{
path.Points[path.Points.Count - 1] = point;
point0 = point;
delta0 += delta;
}
else
{
path.Points.Add(point0);
path.Points.Add(point);
point0 = point;
delta0 = delta;
}
if (marker != null)
{
marker.Origin = point;
coords.Position =
new Point3D(point.X - labelOffset, point.Y - labelOffset, point.Z + labelOffset);
coords.Text = string.Format(coordinateFormat, point.X, point.Y, point.Z);
}
}
Pruning Points on a Line
Linear moves are very common in motion control for making straight cuts or simply moving the tool to a new location. A long linear move will result in many data points along a single straight line. Pruning these intermediate points will significantly reduce the number of line segments in the trace.
The AddPoint() method is being fed a stream of 3D locations in real-time. Call them points A, B and C. The initial method call with point A will simply call the NewTrace() method which constructs the initial LinesVisual3D object. The second method call with point B will plot the first line segment AB. The third method call with point C will plot the second line segment BC.
However, what if point B lies on (or very near) line segment AC as would be the case during a linear move? We would want to simply extend line segment AB to point C instead of adding a second line segment BC.
Line segments AB and BC are vectors in 3-space, and the “cross product magnitude” calculation |AB X BC| is the area of the trapezoid formed by these two vectors – as shown in the above illustration. It can clearly be seen that this area drops towards zero for two vectors that are very nearly parallel. After logging these values, I concluded that 0.001 was a reasonable threshold for determining that point B lies on line segment AC.
Note that this pruning algorithm will continue to extend a line segment as long as each new point continues to lie on the line. The demo app displays both the cross product calculation and the number of triangles in the mesh. When running the app, notice that the number of triangles hardly increases during the linear segments of the spiral.
Motion Commander Foundation (MCF) is a set of .NET libraries, documentation and examples that enable the rapid creation of sophisticated and professional C# or Visual Basic machine control applications.
MCF provides the infrastructure (data management, plotting, alarms, message logging, user login, internationalization, Modbus, MTConnect, etc) - so that you can focus on the business logic and user interface for your machine!
MCF is designed around Microsoft .NET best practices to be intuitive for experienced developers, and examples are provided that will enable even novice .NET developers to get started easily.


 General
  News
News  Suggestion
  Question
  Bug
Bug  Answer
  Joke
Joke  Praise
  Rant
Rant  Admin
Admin 


