Many times, when you are debugging your code deep inside chain of methods, you might need to know the value of simple or complex objects passed as method arguments. If you have a breakpoint set in a method, then you can always go back to caller method and just inspect the values. However, this could be a cumbersome approach and there is an easier way.
Let’s take a look at an example. Let’s say we are debugging a program and have the following call stack available in Visual Studio.
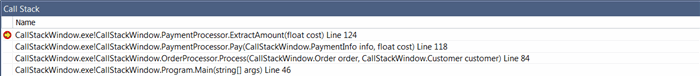
At this point, code is stopped at the ExtractAmount method that has a float type cost argument. In addition, caller of this method Pay has PaymentInfo and float type objects as arguments. Finally, the caller of Pay method Process has Order and Customer as arguments. If we want to see the values of the arguments of all methods involved, we can just right click on the Callstack window that it will bring the following pop-up dialog with an option to “Show Parameter Values”.

If we select this option now, the Callstack will look as follows:
It's better than before as we can see the simple data type values (float in this case) but the complex object type values are not showing any useful values. The reason is that by default, debugger shows the type of an object as value in debugger related windows such as Callstack. However, we can take advantage of DebuggerDisplay attribute to display more friendly information here. The code snippet below shows how we can decorate Customer, Order and PaymentInfo classes to show more user-friendly information in Callstack window.
[DebuggerDisplay("Customer ID {CustomerId}")]
public class Customer
{
public int CustomerId { get; set; }
public string CustomerName { get; set; }
public PaymentInfo PaymentInformation { get; set; }
}
[DebuggerDisplay("Order Id {OrderId}")]
public class Order
{
public int OrderId { get; set; }
public List<Product> SelectedProducts { get; set; }
}
[DebuggerDisplay("CC {CreditCardNumber}")]
public class PaymentInfo
{
public string CreditCardNumber { get; set; }
public DateTime ExpiryDate { get; set; }
}
With these changes applied, Callstack new window looks as follows:
Much better. Isn’t it? One thing to keep in mind is that the “Show Parameter Values” setting is unchecked by default as enabling it does add some performance cost because Debugger now needs to evaluate the values of these objects in callstack window. However, if Callstack window is not visible while “Show Parameter Values” is enabled, then there will be no performance impact.
Until next time, happy debugging!
Kamran Bilgrami is a seasoned software developer with background in designing mission critical applications for carrier grade telecom networks. More recently he is involved in design & development of real-time biometric based security solutions. His areas of interest include .NET, software security, mathematical modeling and patterns.
He blogs regularly at http://WindowsDebugging.Wordpress.com


 General
  News
News  Suggestion
  Question
  Bug
Bug  Answer
  Joke
Joke  Praise
  Rant
Rant  Admin
Admin 


