Introduction
As developers, we often forget (and sometimes even dread) the debugging step in the software development ladder, but when the time comes to debug our software, we usually perform the same manual steps, constantly expanding and examining various pieces of information, trying to capture in our minds the complete picture of what went wrong and why.
OzCode, the innovative C# debugging extension for Visual Studio, completely transforms the way we debug our C# code! OzCode enhances the Visual Studio debugging experience with powerful visualizations, smart object inspection, searching and filtering collections, allowing you to focus on the relevant data. In this article, we demonstrate some of OzCode's capabilities.
Getting Started: Reveal, Simplify and Search
After installing OzCode, you will notice a number of new things when you run your program under the debugger. As soon as a breakpoint is hit, hover over any of the variables, and you will see OzCode's enhanced DataTip:
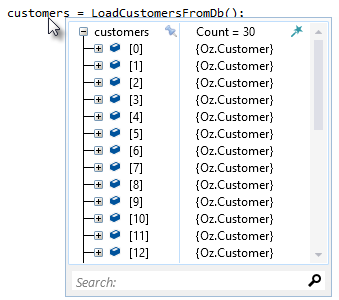
Figure 1: OzCode DataTip, showing the value of customers collection
The DataTip, or the Object Inspector, is where you spend most of your time inspecting values, trying to find what you're looking for. OzCode's DataTip allows you to get lots of information about your objects without having to expand each and every one of them. In Figure 1, all 30 of the customers look alike, making it hard to tell which is which. Each Customer object might contain many properties, but we might only be interested in a few. Using OzCode's Reveal we can look for just the ones we want without wasting time:

Figure 2: Revealing object properties
Reveal allows us to focus only on the properties that we're interested in, such as ID and FullName, by clicking on the icon next to the property name, and those "starred" properties will immediately appear for all the items of the same type in that collection.
Figure 3: Revealed customers
OzCode also allows you to do a Search inside any type of object, by using the Search text box at the bottom of the DataTip. The results will be shown as soon as they are found:
Figure 4: Searching for "Michael" inside objects
Now that we've made our objects look more clear, it is time to make sense of how the rest of the code is being used, what methods are being called and what values are returned from them. We can get all this information in a glance with OzCode's strong>Simplify. When stepping over a statement, OzCode provides a visual representation of what each predicate is evaluated to, and the return value of any inline and nested method calls.
Figure 5: if statement is ready to be Simplified
Clicking on the icon will place additional information on each part of the statement, allowing us to see the overall result, and let us drill-down into individual steps:
Figure 6: Understanding why if returned false
Using the arrows (or pressing the shortcut keys Alt-K or Alt-J), we can drill down into individual parts of the if statement. In the example in Figure 6, if we press down once, we will see that the method IsLotteryWinner returned true (therefore IsVIP was not even executed), but IsBudgetAvailable returned false, therefore the result of the entire statement is false. Drilling down once more would show us the result of CalculateGiftCost as well.
Figure 7: Going deeper
Simplify makes it really easy to figure out why certain values were returned after the fact, without having to use temporary variables or evaluating expressions in the Watch.
Visualizing the Debugger
When you debug your program with OzCode installed, you will notice a couple of new icons. Most of those icons provide contextual actions, depending on what is happening in your code. Other icons appear always, allowing you to perform debugging-related operations easily.
Figure 8: the QuickActions bar in Visual Studio
QuickActions allow you to perform various operations on the code that is currently being debugged. The image in Figure 8 shows a set of context actions available for the current line being stepped on in the debugger. QuickActions can be activated with a mouse-click, or by pressing Alt-Shift-D.
The first option we see in Figure 8 is Show all Instances. This feature allows you to find all the instances of the particular type that is currently loaded in your application's memory (the managed heap):
Figure 9: showing all instances of the type Customer
Here we can see all the instances that are currently active in memory. OzCode remembers all previous settings defined for a particular type, such as Reveal, as well as allowing you to Search inside the displayed items.
Show all Instances is also useful for exploring the managed heap and visualizing any reference or boxed value type – by specifying its fully qualified name (aided by IntelliSense). In Figure 10 below, all the System. String instances of our process are being displayed:
Figure 10: exploring the managed heap
In addition, we can use Show all Instances to find all the values of particular properties or fields of an object in all instances, by clicking on the icon next to the property:
Figure 11: Show values of State in all instances of Address
Finally, clicking the icon at the class name level will allow you to quickly add (or remove any existing) breakpoints in all the members in the type!
Next, we'll look at how we can get rich information about the code that is executing without changing a single line, or littering the code with logging statements.
Suppose you have a method, and it's being called from multiple threads, so it's not really convenient to try and debug it by just putting in a breakpoint and trying to step through the code – you'd be constantly flipping around between threads and losing context. With OzCode's Tracepoints, we can trace all calls to this method. Clicking the icon next to the method name will allow you to trace every entry into the method. After selecting it, the following window will open:
Figure 12: Tracepoint dialog, with the message pre-populated
You can specify any custom message in the Expression field, as well as specifying the values for any local variables or other code expressions in general. In the bottom text box, you'll see a preview of what this expression will look like.
Figure 13: Adding more values to Tracepoint
After continuing execution, you'll see at the bottom-right corner of your Visual Studio a new icon, indicating that trace messages are available:
Figure 14: Tracepoint messages
You can view the trace messages by clicking View Messages, and they will open in the OzCode built-in trace log viewer, allowing you to search, filter, and sort the trace messages to find what you're looking for:
Figure 15: Tracepoints message viewer. Supports exporting to Excel
There are many more contextual actions available for a wide variety of objects, with the Magic Wand, feature, allowing you to perform additional operations, such as setting conditional breakpoints without leaving the DataTip!
Figure 16: Magic Wand shows additional actions for the selected object
Working with Exceptions
Every once in a while we have to deal with Exceptions in our code. OzCode's Exceptions Trail makes it easy to investigate any exception. When an exception occurs, you can view its details using the "View exception details" QuickAction:
Figure 17: this QuickAction is available everywhere, as long as there's an exception in scope
Which will open the following window:
Figure 18: Showing exception details. Navigate between inner exceptions easily!
As you can see in Figure 18, all nested inner exceptions appear in a nice breadcrumb control, allowing to investigate the root cause easily, as well as searching for the exception text in Google or StackOverflow straight from the Exceptions Trail window. At the bottom you can see all the details about the selected exception, and all other OzCode features, such as Reveal or Search are available. Finally, this window will continue showing exception details even after you stop debugging, allowing you to navigate the call stack even when the process was terminated.
Comparing and Filtering
OzCode makes it easy to find the needle in a haystack of data. Suppose we have a collection of 30 items, each item is a Person object with a name and an age. Now, let's say we want to show only those who are under the age of 30, so we can Filter the collection. The following animation demonstrates how to do this:
Figure 19: Filtering a collection by a predicate
Another cool thing we can do with OzCode is to Compare two (or more) different instances of an object, and seeing the differences between them. In Figure 20 below, we can see 2 instances of a PhoneBook object, one of which doesn't display information correctly. We can see the differences highlighted in red:
Figure 20: seeing the differences between two objects
Getting OzCode
There are many more things OzCode can do that make C# debugging a breeze! We urge you to check out all of instructional videos, and watch our instructional videos on how to get started.
You can try OzCode FREE for 30 days, and it works with Visual Studio 2010, 2012, 2013 and will soon support the upcoming Visual Studio 2015.
Magical Debugging!
Igal is a Senior Consultant and Instructor at CodeValue, an agile software developer with strong passion for programming and best software development practices.
He is an expert in creating and developing clean code, practices TDD and continuous refactoring to remove complexity, reduce bugs and achieve for better design.
Igal is a .NET Framework expert with strong background in .NET and Windows internals, as well as strong skills and knowledge in higher-level C# design patterns and methodologies. He has very big thirst for knowledge and continuous improvement. Igal is passionate about productivity, agile software development practices and methodologies, DevOPs and automation. Igal has many years of training under his belt, and frequently speaks about various topics at local and international conferences.


