Introduction
This project describes how to show weather report of a particular location according to date and time in line chart, i.e., display data in graphical format.
Step 1
First of all, we will have to get weather report data according to location and date. Like suppose we want to know weather condition of London on 31-12-2014.
Weather Underground Server of Airport of England will help us to get weather information according to location and date.
How to get it?
www.wunderground.com will give us data. And the requested URL is
http://www.wunderground.com/history/airport/AAAA/YYYY/MM/DD/DailyHistory.html?HideSpecis=1&format=1
where AAAA=”Location Code of that area” and YYYY/MM/DD is date format. Then it will return data in string format. We will have to parse that data according to our requirements and will have to use respective records in displaying in graphical format.
You can see the returned data from server in your web page by this URL.
http://www.wunderground.com/history/airport/EGLL/2014/12/31/DailyHistory.html?HideSpecis=1&format=1
Step 2
After this, there would be some missing records in returned data and errors also like -9999.0, N/A, “”,-9999 and variable, etc. So we will have to normalize the records also.
Suppose if record is not available for selected location and time, then we will have to handle this problem too.
Step 3
Now we will have to separate records according to our requirements like suppose we want to display only temperature variation over time, then we will have to collect temperature value according to its time frame. Similarly, we will have others also like wind speed, atmospheric pressure and others as well.
Step 4
Now show the data in graph.
Demo
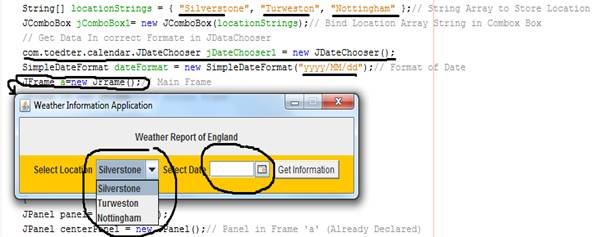
- When the program starts, first frame appears with location and date selection.
Location string contains Location which binds in JComboBox. JDateChoose is library file that is third party tool used in selecting date (you can see it and date format).
- Date chooser is like this:

- When you click on Get Information button, New frame appears that shows graph like this:
- If you want to see more specific data, you will have to zoom in graph by holding left mouse click and drag down the mouse. In this graph, you can see specific data about pressure for the above graph.
Since graph line is straight in the above graph while in this graph not.
Code
A snap of WeatherGUI.Java file:
- JFrame ’
a’ and JFrame ‘b’ is declared here which are main frame for this project. - A function called
MainINterface() is used to call in main method while load program this contain frame a in which date chooser and select location operation is performed. When button click operation fired, it validates data like date is in range and in correct format. You can see in the following image. Applied on JFrame ‘a’.
- When button click event is fired, then it will have to validate date and location, it can be seen in the following image:
- If everything is okay, then it is time to make URL
string to get data from weather underground server and send it a method that gets data and parses it according to respective category and add in ArrayList ‘md’. But here, we will have to take care of data validation and control like -9999.0, N/A,-9999 and Null. So here, we are storing 0 of data is anything like them.
- Now if no such data is available for selected location and date, then we will have to check it also so here if
md.size<36 then no data is available.
- Now we have separate
ArrayList for every time, temperature, pressure, wind speed and precipitate so we will have to get all data from ‘md’ ArrayList and will have to assign corresponding value in these array lists.
- Now this time to draw chart so
draw_chart() is method for this work. This method wants JFreeChart a third party library from Oracle.
This member has not yet provided a Biography. Assume it's interesting and varied, and probably something to do with programming.


 General
  News
News  Suggestion
  Question
  Bug
Bug  Answer
  Joke
Joke  Praise
  Rant
Rant  Admin
Admin 


