This article shows you how to create a 2D graph using a library of code called morphologica. It describes how you first install dependencies on Linux or Mac, then how to download the morphologica library from github.com. It helps you to create a CMakeLists.txt file for directed compilation with cmake, how to write a single file program to draw the graph, how to compile the program and finally how to explore some of the additional features of morphologica's 2D graph class.
Introduction
This article will walk you through the steps you need to draw beautiful 2D graphs from your C++ programs using a header-only library called morphologica. The graphs are drawn using OpenGL and are of publication quality. Because morphologica graphs are fast to render, they're ideal for use in simulations for real-time visualization or to make frames for datavis movies.
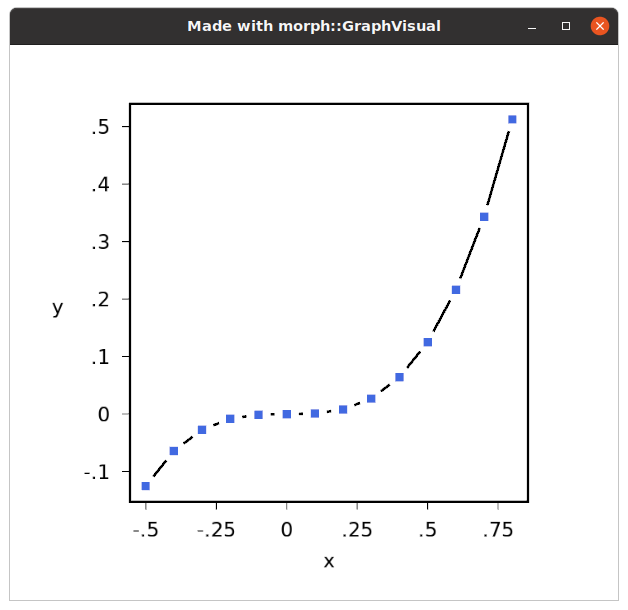
When you've completed this article, you'll be able to draw graphs like this one:
Background
Morphologica was developed by computational neuroscientists at The University of Sheffield as a header-only library of code for three tasks: reading program configuration in JSON; saving simulation output in a common data format and performing OpenGL visualization. It's just the last of these tasks that we're interested in for this article. Because the code is header only, you'll only compile the visualization code into your program (so there's no clutter from any of the other code). To use the code in this article, you'll need a copy of the morphologica headers and you'll need to link in the libraries that the code depends on. The first section of the article shows how to set this up using CMake on Linux or Mac (the code also works on Windows). I'll assume you have CMake and a C++ compiler like gcc or clang already installed and ready to use.
Creating a Basic 2D Graph
There are four steps to take to compile a graph: First, we install some libraries that the program will require; second, we download and install morphologica headers; third, we create a CMake compilation file and finally, we create the program file, then compile it.
Installing Dependencies
There are some libraries that the program will need. You need to have an OpenGL-capable graphics driver, the OpenGL libraries, a library called GLFW3 and the Freetype font rendering library. If you're on a Debian-like Linux such as Ubuntu, you can install these with the command:
sudo apt install build-essential cmake \
                 freeglut3-dev libglu1-mesa-dev libxmu-dev libxi-dev \
                 libglfw3-dev libfreetype-dev
On a Mac, if you have installed XCode, then you should only need to install CMake and GLFW3. Please use your favourite techniques to do this (I use Mac Ports to install cmake and compile/install GLFW3 from source).
Installing Morphologica Headers
The first task is to download morphologica. Download morphologica "The unique_ptr release" from:
You can download either the zip file or the tar.gz file; whichever you prefer, but I downloaded .tar.gz. Now create a folder called 'codeproject' to do the work, and un-pack morphologica-2.0:
[seb@cube 12:54:06 ~]$ mkdir codeproject
[seb@cube 12:54:38 ~]$ mv ~/Downloads/morphologica-2.0.tar.gz codeproject/
[seb@cube 12:54:54 ~]$ cd codeproject/
[seb@cube 12:54:58 codeproject]$ tar xf morphologica-2.0.tar.gz
[seb@cube 12:55:05 codeproject]$ ls
morphologica-2.0  morphologica-2.0.tar.gz
That's it - you've done all you need to do to 'install' morphologica - you have all the headers.
Setting up a CMake Build File
Using CMake is a great way to define how your compiler can find libraries and compile your program. That's what we'll do here to direct the compilation of a morphologica graph program.
CMake takes a configuration file called CMakeLists.txt. In your CodeProject folder, edit a CMakeLists.txt file and put this first, boilerplate section in - this can be almost the same for any morphologica-containing program.
#
# This is an example CMakeLists.txt file to compile a program with morphologica headers
#

# cmake version 3.1 provides the set(CMAKE_CXX_STANDARD 17) feature
cmake_minimum_required(VERSION 3.1)

# Give your project a name
project(codeproject)

# From CMAKE_SYSTEM work out which of __OSX__, __GLN__, __NIX__ are required
if(CMAKE_SYSTEM MATCHES Linux.*)
  set(OS_FLAG "-D__GLN__")
elseif(CMAKE_SYSTEM MATCHES BSD.*)
  set(OS_FLAG "-D__NIX__")
elseif(APPLE)
  set(OS_FLAG "-D__OSX__")
else()
  message(ERROR "Operating system not supported: " ${CMAKE_SYSTEM})
endif()

# morphologica uses c++-17 language features
set(CMAKE_CXX_STANDARD 17)

# Add the host definition to CXXFLAGS along with other switches, depending on OS/Compiler
if (APPLE)
  set(CMAKE_CXX_FLAGS "${OS_FLAG} -Wall -Wfatal-errors -Wno-missing-braces -g -O3")
else()
  # This assumes a gcc compiler (or a gcc mimic like Clang)
  set(CMAKE_CXX_FLAGS "${OS_FLAG} -Wall -Wfatal-errors -Wno-missing-braces -g -O3 -Wno-unused-result -Wno-unknown-pragmas -march=native")
endif()

# Additional GL compiler flags.
set(OpenGL_GL_PREFERENCE "GLVND") # Following `cmake --help-policy CMP0072`
set(CMAKE_CXX_FLAGS "${CMAKE_CXX_FLAGS} -DGL3_PROTOTYPES -DGL_GLEXT_PROTOTYPES")
if(APPLE)
  set(CMAKE_CXX_FLAGS "${CMAKE_CXX_FLAGS} -DGL_SILENCE_DEPRECATION")
endif()

# Tell the program where the morph fonts are
# (in morphologica-2.0 that you just downloaded):
set(CMAKE_CXX_FLAGS "${CMAKE_CXX_FLAGS} -DMORPH_FONTS_DIR=\"\\\"${PROJECT_SOURCE_DIR}/morphologica-2.0/fonts\\\"\"")

# Find the 3 dependency libraries which are needed to draw graphs
find_package(OpenGL REQUIRED)
find_package(glfw3 3.3 REQUIRED)
find_package(Freetype REQUIRED)

# Tell compiler where to find the included dependencies
include_directories(${OpenCV_INCLUDE_DIRS} ${OPENGL_INCLUDE_DIR}
${GLFW3_INCLUDE_DIR} ${FREETYPE_INCLUDE_DIRS})

# Tell compiler where to find the morphologica headers
set(MORPH_INCLUDE_PATH "${PROJECT_SOURCE_DIR}/morphologica-2.0" CACHE PATH "The path to morphologica")
include_directories(BEFORE ${MORPH_INCLUDE_PATH}/include) # Allows GL3/gl3.h to be found
include_directories(BEFORE ${MORPH_INCLUDE_PATH})         # Allows morph/Header.h
                                                          # to be found
Now we are going to add some more lines to CMakeLists.txt to say how our program will be compiled. Add these lines:
# Our program will be written in a single file called graph2d.cpp and
# compiled into the exe graph2d:
add_executable(graph2d graph2d.cpp)

# We need to tell the compiler to link the OpenGL
# and Freetype libraries to the graph2d executable
target_link_libraries(graph2d OpenGL::GL Freetype::Freetype glfw)
Create the Code to Draw a Graph
Now we're ready to edit our program. Still in the codeproject folder, create graph2d.cpp with your favourite text editor and place the following lines of code into the file to #include what we need:
#include <vector>
#include <morph/Visual.h>
#include <morph/GraphVisual.h>
We're going to use std::vector from the standard library to hold the data that we'll graph and we include morph/Visual.h to bring in the class morph::Visual which provides the graphics 'scene'. morph::Visual provides a very simple 3D world in which one or more morph::VisualModel objects can be rendered. morph/GraphVisual.h brings in the class morph::GraphVisual which is a specialisation of a morph::VisualModel specifically designed to render 2D graphs. So each graph in a scene is a 'graphics model' made up of triangle primitives just like most other OpenGL models.
Now we'll write the main() function; start with the line:
int main() {
The first task is to create the morph::Visual scene. In the constructor, we specify that the window will be 1024 by 768 pixels in size and give it a window title:
morph::Visual v(1024, 768, "Made with morph::GraphVisual");
Now we create some data containers and populate them. This is ordinary C++ and doesn't make use of any morphologica functionality (though morphologica has a nice class called morph::vVector, which is like std::vector with maths built in). We create an 'x' and a 'y' with y=x3
std::vector<double> x(14, 0.0);
std::vector<double> y(14, 0.0);
double val = -0.5;
for (unsigned int i = 0; i < 14; ++i) {
x[i] = val;
y[i] = val * val * val;
val += 0.1;
}
Now we have data to graph, we need to create a morph::GraphVisual object and pass it the data. We call the GraphVisual constructor and have to pass in three arguments. The first two, v.shaderprog and v.tshaderprog, are integer references to the two shader programs used by the OpenGL subsystem (one to render 3D objects and one to render text objects). The design of morph::Visual means that this is just essential boilerplate code, but you don't need to know any more about it than this. The third argument, given as a literal here ({0,0,0}) is a 3 dimensional coordinate that defines where in the scene the GraphVisual model will be placed. Important when placing several models within a single morph::Visual scene. The function GraphVisual::setdata() copies the data points to be graphed into the GraphVisual object and then GraphVisual::finalize() calls functions in morph::GraphVisual and morph::VisualModel that define all the triangle vertices that make up the 3D model and make it possible for OpenGL to do the rendering magic. Note that GraphVisual is a templated class, where the template argument is used for the type of the data that will be graphed. Here, we're using double precision numbers for our data.
auto gv = std::make_unique<morph::GraphVisual<double>> (v.shaders, morph::vec<float>({0,0,0}));
gv->setdata (x, y);
gv->finalize();
Once the morph::GraphVisual has been created and finalized, it can be added to the morph::Visual scene and then rendered:
v.addVisualModel (gv);
v.keepOpen();
Lastly, return 0 and close the main() function:
    return 0;
}
Compiling the Program
You're now ready to do a CMake directed compilation of the program. Make sure you're in the codeproject folder and run:
cmake .
make graph2d
./graph2d
You should see a window appear with your graph in it. You can right-click on the graph and move the mouse to move the graph around in the scene. You can mouse-wheel to zoom in and out. Press 'c' to see a coordinate axes object appear. Press 'h' and see stdout for other features that morphologica gives you. When you're done, it's 'x' to exit (or use the window close button).
Modifying the Graph's Features
Ok, so that's a default graph. Let's explore the features of morph::GraphVisual. To change features such as graph legend, axis labels and so on, we make changes before the line gv->finalize();
Axis Labels
Suppose we want the x axis label to be 'z' instead of 'x' and we want the y axis label to be phi(z) (that is, the Greek letter phi). We insert calls to GraphVisual::xlabel and GraphVisual::ylabel between setdata() and finalize():
gv->setdata (x, y);

gv->xlabel = "z";
std::string y_label = morph::unicode::toUtf8 (morph::unicode::phi) + "(z)";
gv->ylabel = y_label;

gv->finalize();
The xlabel was simple, we just used the string constant "z". To set the y label to include a Greek symbol, we used morphologica's built in ability to write unicode characters into a string (as UTF-8) and render them with the DejaVu font (which is built in to the executable).
Legends
GraphVisual allows you to set legends for your data. Use an overload of setdata() for this. Replace the setdata line with this:
gv->setdata (x, y, "Cubic function");
The legend is rendered above the box of the graph.
Line and Marker Styles
To format the style of the data line - what markers are used, the color and whether the line is filled or dashed, you can define a morph::DatasetStyle. The DatasetStyle is then passed in to another overload of the setdata() function.
These lines of code go in before your call to gv->setdata(x, y):
morph::DatasetStyle ds(morph::stylepolicy::lines);
ds.linecolour = {0.4, 0.0, 0.1};
ds.linewidth = 0.005f;
ds.datalabel = "Cubic function";
gv->setdata (x, y, ds);
The code above should give you a graph with just lines, no markers and with the fairly thin line drawn in red. For markers only, try this:
morph::DatasetStyle ds(morph::stylepolicy::markers);
ds.markerstyle = morph::markerstyle::triangle;
ds.markercolour = morph::colour::crimson;
ds.datalabel = morph::unicode::toUtf8 (morph::unicode::phi);
gv->setdata (x, y, ds);
I used named colours here. You can find the colours and their names at this web page: http://www.cloford.com/resources/colours/500col.htm
To set both marker style and line style, just set them both in the DatasetStyle:
morph::DatasetStyle ds(morph::stylepolicy::both);
ds.markerstyle = morph::markerstyle::diamond;
ds.markercolour = morph::colour::crimson;
ds.linecolour = morph::colour::dodgerblue3;
ds.datalabel = morph::unicode::toUtf8 (morph::unicode::phi);

gv->setdata (x, y, ds);
The final graph, with axis labels, legends and modified line style looks like this:

For reference, the options for markerstyle are found in morph/GraphVisual.h:
enum class markerstyle
{
none,
triangle,
uptriangle,
downtriangle,
square,
diamond,
pentagon, uppentagon,
hexagon,
uphexagon,
heptagon,
upheptagon,
octagon,
upoctagon,
circle,
bar, numstyles
};
Points of Interest
I hope this gives you a feel for how morph::GraphVisual allows you to plot 2D graphs in your C++ programs. For more examples, see the examples/ folder in morphologica (find graph1.cpp, graph2.cpp, etc). Some of the topics not covered in this article include: adding multiple graphs to one morph::Visual scene; dynamically updating graphs; twin axis graphs (with two y axes); and special bar graphs. These are topics for future articles.
Notice how the memory management works for morph::GraphVisual. You create a new instance with std::make_unique<> (which creates an std::unique_ptr), and then you pass ownership of that instance to the morph::Visual with v.addVisualModel (gv). The program deallocates the GraphVisual at program completion, as the std::unique_ptr goes out of scope.
Here's one last fun thing to try: The OpenGL model that makes up the lines and shapes of the graph are really a 3D model. Put the following line into your program just after gv->finalize() and re-compile:
gv->twodimensional = false;
Now run the program, click in the window with your main mouse button and drag.
History
- 1st August, 2022: Initial version
- 2nd August, 2022: Improved description of code
- 8th March 2023: Updated to reflect important change in morphologica (use of unique_ptrs)
Research Associate in Computational Neuroscience at The University of Sheffield. I build developmental biology simulations in C++. I use high performance OpenGL visualisation to help.


 General
  News
News  Suggestion
  Question
  Bug
Bug  Answer
  Joke
Joke  Praise
  Rant
Rant  Admin
Admin 


