The implementations presented and discussed here revolve around an equation called Spectral Forecast. The equation can be used to combine two signals into a third, in whatever proportion is desirable. Eight programming and scripting languages were used for implementation, namely: C#, VB, PHP, Perl, Ruby, Java, Javascript and Python.
Background
One of the most simple applications that can be made in order to understand the spectral forecast equation, is related to signals. A question that can be asked would be: given two signals A and B, what would a third signal M look like if it must resemble both signals in a certain proportion? For instance, a signal M may be required to resemble signal A in a proportion of 23% and signal B in a remaining proportion of 77%. This is exactly what the spectral equation provides, namely a direct way of obtaining such an intermediary signal. Moreover, the Spectral Forecast equation can also be applied to matrices (two dimensions), but also to mathematical objects with more than two or three dimensions. As a side note, Spectral Forecast was published in 2020 in the journal Chaos of the American Institute of Physics. Prior to publication, the formula was used for matrices and not for signals, but it seems that it can be applied for one-dimensional objects as well as for multidimensional objects. Before continuing this reading, please see a live demonstration of what the Spectral forecast can do, for signals.
The Formula
The main equation shown below can be used to combine & scale two signals into a third. The two signals can be mixed in whatever proportion one desires. Spectral forecast can be applied to signals as it was shown in here, or in a graphical representation as shown in here. For signals, the Spectral forecast equation takes the following form:

Where Max (Ai) is the maximum value found above signal A and Max (Bi) is the maximum value found above the components of signal B. Ai and Bi also represent the homologous values of the two signals at position i. Last but not least, Max (d) represents the maximum value between Max (Ai) and Max (Bi). Therefore the value of d can take values between 0 and Max (d). The above expression translates into JavaScript as seen below:
max = Math.max(maxA, maxB)
v = ((d/maxA)*tA[i])+(((max-d)/maxB)*tB[i]);
Where tA and tB are the vectors that hold the consecutive values of the two signals. The v variable holds the value for the third signal at position i. Note that the maximum distance is the maximum value found over the two signals. The linear form of the equation is used directly in the following JavaScript implementation.
Using the Code
For exemplification, I chose JavaScript due to the possibility of immediate experimentation, but note that the example is implemented in 8 different programming or scripting languages. Consider two signals A and B, under this form:
A ='10.3,23.4,44.8,63.2,44.1,35.1,46.5,62.6,50.4,28.9,24.7';
B ='18.8,43.1,52.2,45.5,46.8,46.6,67.9,66.3,70.4,62,39.7';
What would a third signal M look like if it must resemble both signals A and B? What is M must resemble signal A in certain proportion? By applying the spectral forecast equation, a short implementation can be designed to obtain an intermediate M signal:
var tA = [];
var tB = [];
var A ='10.3,23.4,44.8,63.2,44.1,35.1,46.5,62.6,50.4,28.9,24.7';
var B ='18.8,43.1,52.2,45.5,46.8,46.6,67.9,66.3,70.4,62,39.7';
var M ='';
var tA = A.split(',');
var tB = B.split(',');
var maxA = Math.max.apply(null, tA);
var maxB = Math.max.apply(null, tB);
var max = Math.max(maxA, maxB)
var d = 33;
for(var i=0; i < tA.length; i++) {
var tmp = ((d/maxA)*tA[i])+(((max-d)/maxB)*tB[i]);
M += tmp.toFixed(2);
if(i < tA.length-1){M += ','}
}
document.write('Signal A:<br>'+A+'<br>');
document.write('Max(A[i]):'+maxA+'<hr>');
document.write('Signal M:<br>'+M+'<hr>');
document.write('Signal B:<br>'+B+'<br>');
document.write('Max(B[i]):'+maxB+'<hr>');
Output
Signal A:
10.3,23.4,44.8,63.2,44.1,35.1,46.5,62.6,50.4,28.9,24.7
Max(A[i]):63.2
Signal M:
15.37,35.12,51.12,57.17,47.89,43.08,60.35,67.91,63.72,48.03,33.99
Signal B:
18.8,43.1,52.2,45.5,46.8,46.6,67.9,66.3,70.4,62,39.7
Max(B[i]):70.4
Note that the two signals are of the same length for ease of demonstration. The above implementation produces a third signal M from two known signals A and B, for a distance d = 33. Notice that max(d) (maximum distance), is the maximum value found above the two signals A and B. Thus, the maximum value found above the two signals A and B represents 100%.
Plot the Signals
Nonetheless, what can be done with this small implementation of Spectral Forecast? A slightly more advanced version, which includes the above implementation and a js chart, can show exactly what the equation does. Consider some longer signals, such as:
var A ='10.3,23.4,44.8,63.2,44.1,35.1,46.5,62.6,50.4,28.9,24.7,
        22.7,43.2,17.2,31.5,8.3,17.9,3.9,4.1,2.3';
var B ='18.8,43.1,52.2,45.5,46.8,46.6,67.9,66.3,70.4,62,39.7,
        50.3,75.9,52.9,44.9,32,64.8,37.4,19.3,9.4';
Since the two signals are sufficiently long, then we can plot them and the result M in the same chart for a visual inspection. Thus, a more advanced form of the implementation can be found here. The ultimate result of the application can be seen here in a few variable steps of d. For instance:

The above animation shows in a dynamic way how two signals can be combined in different proportions depending on the distance (d). The two signals are represented in red and the resulting signal is represented in black for different values of d which are set by the user in real time.
Magic
What if the signals become a little longer and more waveform like? Then a higher resolution is obtained and the results become more visually dynamic. Such a project example can be found here, and the animations taken above this JavaScript application are presented below. Thus, only at this resolution, the usefulness of the method becomes more apparent:
.gif)
.gif)
.gif)
.gif)
For exemplification, these demonstrations were performed on internet browsers by using precalculated waveforms as signals. The question is: what other uses could spectral forecast have? We will probably find out in the future what those are, from one of us. Those who find other Spectral forecast uses are invited to write and discuss about new ideas. This concludes the Spectral forecast method for signals.
Code Projects
Up to this point, all demonstrations have been performed in JavaScript. However, as specified in the background section of this article, these demonstrations are made in eight programming and scripting languages, namely: C#, VB, PHP, Perl, Ruby, Java, Javascript and Python. Thus, for those that wish to download only the open source implementation of their preferred programming or scripting language, then here is the list of repositories:
Mix two signals in CSharp
using System;
public class SpectralForecast
{
public static void Main(string[] args)
{
string A = "10.3,23.4,44.8,63.2,44.1,35.1,46.5,62.6,50.4,28.9,24.7";
string B = "18.8,43.1,52.2,45.5,46.8,46.6,67.9,66.3,70.4,62,39.7";
string[] nA = A.Split(',');
string[] nB = B.Split(',');
double maxA = 0;
double maxB = 0;
string M = "";
double d = 33;
double v = 0;
double[] tA = new double[nA.Length];
double[] tB = new double[nB.Length];
for(int i=0; i < nA.Length; i++)
{
tA[i] = double.Parse(nA[i]);
tB[i] = double.Parse(nB[i]);
if (tA[i] > maxA){maxA = tA[i];}
if (tB[i] > maxB){maxB = tB[i];}
}
double maxAB = Math.Max(maxA, maxB);
for(int i=0; i < tA.Length; i++) {
v = ((d/maxA)*tA[i])+(((maxAB-d)/maxB)*tB[i]);
M += Math.Round(v, 2);
if(i < tA.Length-1){M += ',';}
}
Console.WriteLine (M);
}
}
Mix two signals in VB
Sub main()
Dim tA() As String
Dim tB() As String
A = "10.3,23.4,44.8,63.2,44.1,35.1,46.5,62.6,50.4,28.9,24.7"
B = "18.8,43.1,52.2,45.5,46.8,46.6,67.9,66.3,70.4,62,39.7"
M = ""
tA = Split(A, ",")
tB = Split(B, ",")
For i = 0 To UBound(tA)
If (tA(i) > maxA) Then maxA = tA(i)
If (tB(i) > maxB) Then maxB = tB(i)
If (maxA > Max) Then Max = maxA
If (maxB > Max) Then Max = maxB
Next i
d = 33
For i = 0 To UBound(tA)
v = ((d / maxA) * tA(i)) + (((Max - d) / maxB) * tB(i))
M = M & Round(v, 2)
If (i < UBound(tA) - 1) Then M = M & ","
Next i
s = s & "Signal A: " & A & vbCrLf
s = s & "Max(A[i]):" & maxA & vbCrLf
s = s & "Signal M: " & M & vbCrLf
s = s & "Signal B: " & B & vbCrLf
s = s & "Max(B[i]):" & maxB & vbCrLf
MsgBox s
End Sub
Mix two signals in PHP
$tA = [];
$tB = [];
$d = 33;
$A ='10.3,23.4,44.8,63.2,44.1,35.1,46.5,62.6,50.4,28.9,24.7';
$B ='18.8,43.1,52.2,45.5,46.8,46.6,67.9,66.3,70.4,62,39.7';
$M ='';
$tA = explode(",", $A);
$tB = explode(",", $B);
$maxA = Max($tA);
$maxB = Max($tB);
$max = Max($maxA, $maxB);
for($i=0; $i < count($tA); $i++) {
$v = (($d/$maxA)*$tA[$i])+((($max-$d)/$maxB)*$tB[$i]);
$M .= strval(round($v,2));
if($i < count($tA)-1){$M .= ',';}
}
echo $M;
Mix two signals in Perl
my $A = '10.3,23.4,44.8,63.2,44.1,35.1,46.5,62.6,50.4,28.9,24.7';
my $B = '18.8,43.1,52.2,45.5,46.8,46.6,67.9,66.3,70.4,62,39.7';
my $M = "";
my $d = 33;
my $v = 0;
my @tA = split(',', $A);
my @tB = split(',', $B);
use List::Util qw(min max);
my $maxA = max @tA;
my $maxB = max @tB;
my $maxAB = ($maxA, $maxB)[$maxA < $maxB];
for(my $i = 0; $i <= $
$v = (($d/$maxA)*$tA[$i])+((($maxAB-$d)/$maxB)*$tB[$i]);
$M .= sprintf("%.2f", $v);
if($i < $
}
print($M);
Mix two signals in Ruby
A = "10.3,23.4,44.8,63.2,44.1,35.1,46.5,62.6,50.4,28.9,24.7"
B = "18.8,43.1,52.2,45.5,46.8,46.6,67.9,66.3,70.4,62,39.7"
m = ""
tA = A.split(",")
tB = B.split(",")
maxA = tA.max.to_f
maxB = tB.max.to_f
maxAB = [maxA, maxB].max
d = 33
v = 0
for i in (0...tA.length)
v = ((d / maxA) * (tA[i].to_f)) + (((maxAB - d) / maxB) * (tB[i].to_f))
m += "#{v.round(2)}"
if i < tA.length then m += "," end
end
puts "#{m}"
Mix two signals in Java
public class Main
{
public static void main(String[] args) {
String A = "10.3,23.4,44.8,63.2,44.1,35.1,46.5,62.6,50.4,28.9,24.7";
String B = "18.8,43.1,52.2,45.5,46.8,46.6,67.9,66.3,70.4,62,39.7";
String M = "";
String[] tA = A.split(",");
String[] tB = B.split(",");
float v = 0;
float d = 33;
float maxA = 0;
float maxB = 0;
float maxAB = 0;
for (int i = 0; i < tA.length; i++)
{
if (Float.parseFloat(tA[i]) > maxA){maxA = Float.parseFloat(tA[i]);}
if (Float.parseFloat(tB[i]) > maxB){maxB = Float.parseFloat(tB[i]);}
if (maxA > maxAB){maxAB = maxA;}
if (maxB > maxAB){maxAB = maxB;}
}
for (int i=0; i < tA.length; i++) {
v = ((d/maxA)*Float.parseFloat(tA[i]))+(((maxAB-d)/maxB)*Float.parseFloat(tB[i]));
M += Math.round(v*100)/100.0;
if(i < tA.length-1){M += ",";}
}
System.out.println(M);
}
}
Mix two signals in JavaScript
function sf(A, B, d){
var tA = [];
var tB = [];
var M ='';
var tA = A.split(',');
var tB = B.split(',');
var maxA = Math.max.apply(null, tA);
var maxB = Math.max.apply(null, tB);
var max = Math.max(maxA, maxB);
for(var i=0; i < tA.length; i++) {
var v = ((d/maxA)*tA[i])+(((max-d)/maxB)*tB[i]);
M += v.toFixed(2);
if(i < tA.length-1){M += ','}
}
return M;
}
Mix two signals in Python
A = "10.3,23.4,44.8,63.2,44.1,35.1,46.5,62.6,50.4,28.9,24.7"
B = "18.8,43.1,52.2,45.5,46.8,46.6,67.9,66.3,70.4,62,39.7"
M = ""
tA = list(map(float, A.split(",")))
tB = list(map(float, B.split(",")))
maxA = max(tA)
maxB = max(tB)
maxAB = max(maxA, maxB)
d = 33
for i in range(0, len(tA)):
v = ((d / maxA) * tA[i]) + (((maxAB - d) / maxB) * tB[i])
M += str(round(v,2))
if i < (len(tA) - 1): M += ","
print(M)
Note that if you have a preference that is not listed here, you can leave me a comment. On request, I will port the code in your preferred programming or scripting language. I do not check these articles very often, thus a delay between a request and the update may occur.
Besides the Point
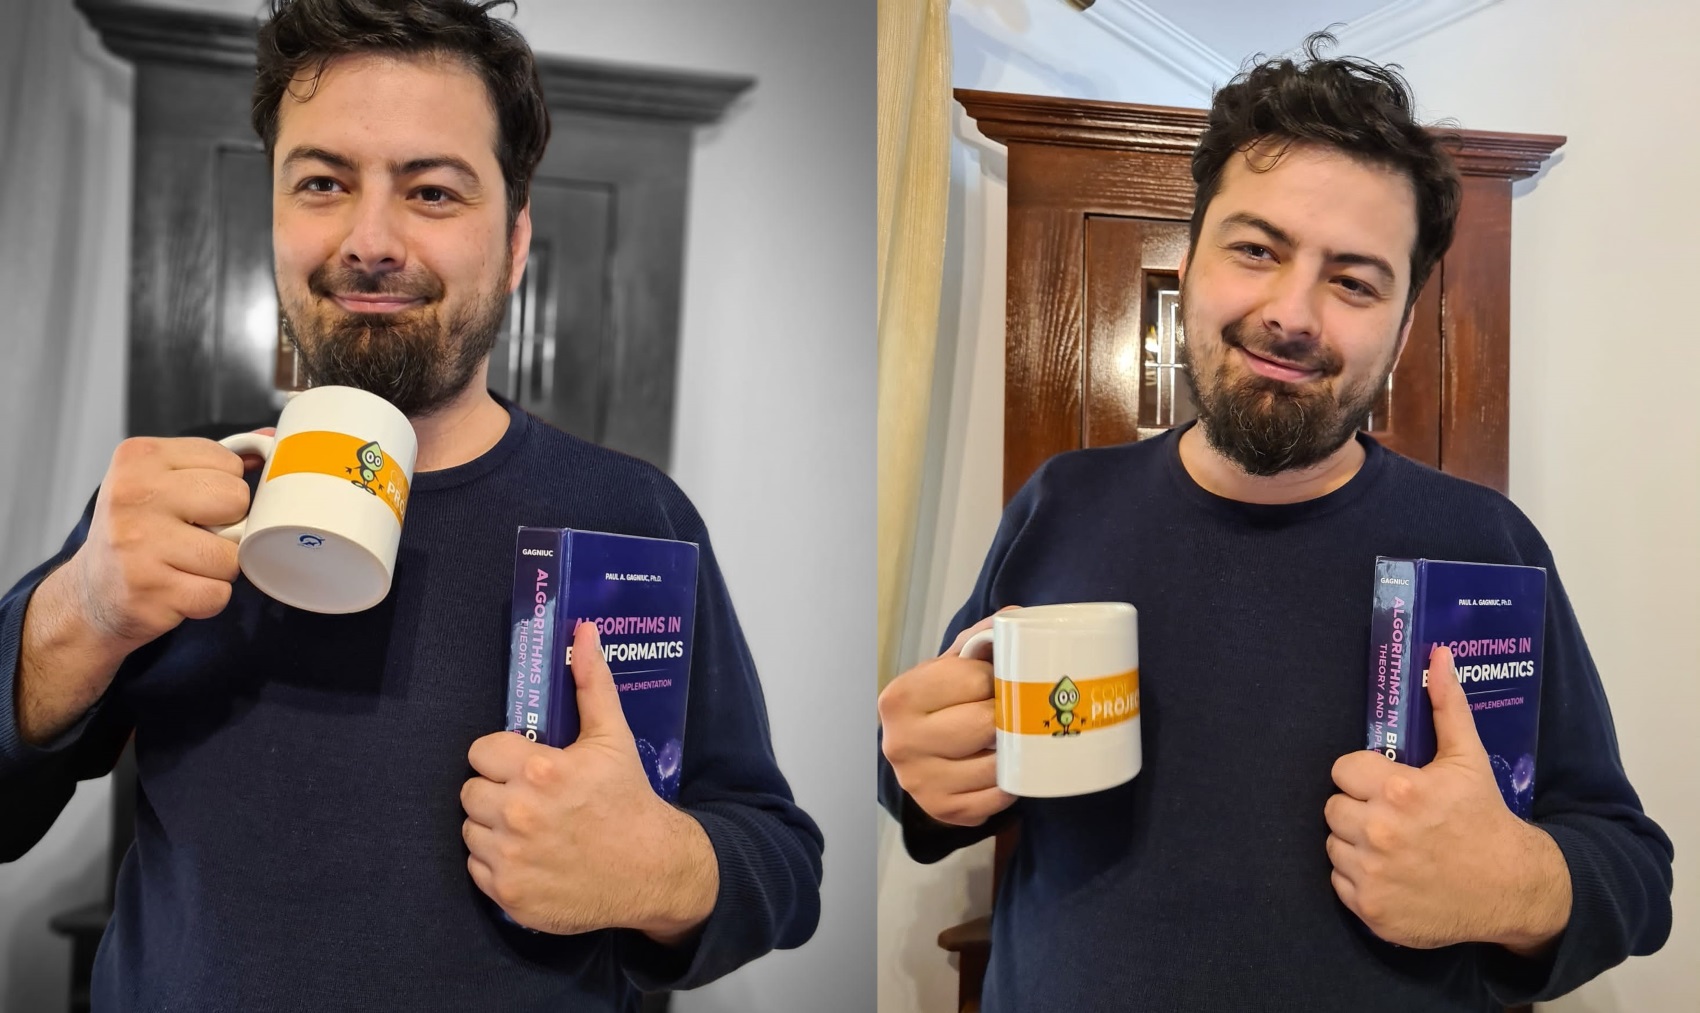
As far as I can tell, CodeProject remains the only serious connection between science and industry, or I might add, between scientists and engineers. Thus, after some years, I decided to write again here on Codeproject, but this time under my real name. Some time in the past, not earlier than 2014, I received a prize for an anonymously written article here on Codeproject. I still have my symbolic prize in my hand in 2022.
Also, I kindly invite you to visit my GitHub account. There, you will find many materials for my students, however, one can also find some interesting and more advanced applications that can be useful for complex projects that one of us may design in the near future.
Useful Links
References
History
- 20th March, 2022: Initial version
This member has not yet provided a Biography. Assume it's interesting and varied, and probably something to do with programming.


