Introduction
Several years ago I wrote a small article entitled, "There and Back Again or Stepping Through the JIT Thunk Layer"
(http://www.codeproject.com/Articles/9557/There-and-Back-Again-or-Stepping-Through-the-JIT-T)
which provided a brief glimpse into the Microsoft .NET V1.1 Just-In-Time, i.e., JIT, compiling and thunk layers for 32-bit processes. It is time to update
this saga but this time targeting 64-bit technologies and a later version of the .NET runtime. For the purposes of this return visit, I am using Visual
Studio 11 Beta running in a virtual machine with Windows Ultimate 7 installed and my own 64-bit debugger, PEBrowseDbg64 Interactive Professional
(http://www.smidgeonsoft.prohosting.com/pebrowse-pro-interactive-debugger.html).
Note: if you have not obtained a copy of the VS11 beta and installed it, earlier versions of Visual Studio with 64-bit technology should be just fine,
allowing for minor differences in the following narrative.
Creating the Test Program
Open Visual Studio and create a C# Windows Forms Application with the name
Wilderland (this recalls references to the book,
"The Hobbit" (http://en.wikipedia.org/wiki/The_Hobbit), embedded throughout my earlier article
and honors J. R. R. Tolkein and the upcoming movie). Change the form's Text property to "Wilderland" and add a button named
LonelyMountain_button
with the Text property, "Lonely Mountain". To the button's
Click event, add the following snippet of code:
int TheOneRing = 0x9731;
LonelyMountain(TheOneRing);
Add the private method, LonelyMountain:
private void LonelyMountain(int MagicRing)
{
    LonelyMountain_button.Text = "Bilbo Lives!";
}
Finally, to the form's FormClosing event, add:
MessageBox.Show("The adventure is ending!", "Farewell");
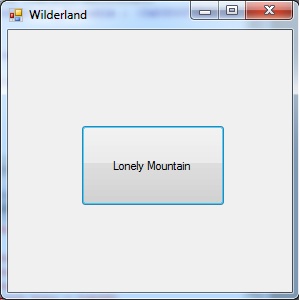
Make sure you target the build for 64-bit, i.e., the Active solution platform is "x64" but not "Any CPU", and compile the program for both Debug and Release
versions (we will be using the Release version during the trip). When you run the program, you should see something resembling the following image:
After downloading and installing PEBrowseDbg64, we are now ready to start our adventure.
Setting the Environment
An absolute priority for following the explanation is access to the correct debug symbols. As part of PEBrowseDbg64's installation, you will find a
small file called _NT_SYMBOL_PATH.txt. If you have not already done so, create an environment variable with the name
of this file (minus the file extension) and set the variable's value equal to the contents of the file. With this small bit of preparation, we can continue.
Launching PEBrowseDbg64, you will see this image:

For those of you who have used my older, 32-bit debugger, PEBrowse Interactive Professional, this window should look familiar.
Starting the Journey
If you are using the VS11 Beta, you will need to check the menu item under Tools/VS11 Beta.
Now, select from the menu
File/Start Program (or Ctl-S) and fill in the ensuing dialog box, thusly:
(The Wilderland program may be located in a different directory for your system.) Press the Start button and you should now see:
The debugger has halted your program here because of the checkbox, Debug loader startup code? If you have ever wondered how Windows programs get off the ground,
i.e., before your program's main routine is called, you can start single-stepping (F11) here and into the call to LdrpInitialize. For now, press F5, or Debug/Go
and the next, "normal" breakpoint will fire inside the NTDLL routine,
LdrpDoDebuggerBreak. This is the same initial breakpoint you will encounter using other debuggers,
e.g., WinDbg. Pressing F5 again will yield (you may see an intervening exception which you can safely ignore):
As the name of the routine suggests, the .NET runtime is building the environment, i.e., AppDomain, in which your managed code will run. We are
offered a chance to investigate this because we selected the checkbox, Break on 1st JIT event? in the Debug Session Start
dialog box. The Intermediate Language, or IL, for this routine can be accessed by locating the method inside of MSCORLIB.NI.DLL
using the treeview index on the left and displaying the .NET methods - more on this in a bit.
Pressing F5 once more will display:
Some of the nodes in the treeview are now displayed in red and indicate new or changed memory allocations. Now, expanding the WILDERLAND.EXE node
gains browse access to the internals of the file along with .NET methods and metadata, exports (if any), and debug symbols (if available).
Navigate to the .NET Methods node and select the menu item View/Display.NET Methods and expand the Wilderland::Form1 node.
The new window should look something like this:
Select the LonelyMountain_button_click item and the menu item Edit/Add Breakpoint at 06000003, which just happens to be the
MethodDef
behind the click event for the button, LonelyMountain. This activity corresponds to the normal opportunity for setting breakpoints inside of your
managed code using development environments like Visual Studio. However, if you select the menu item View/Debug Windows/.NET JIT Events:
you will discover a lot of activity has already taken place with your program. This is, of course, the AppDomain setup process, mentioned earlier in
this article. Setting breakpoints on any of these and restarting the debug session gives you the opportunity of exploring more of the startup activity.
Entering Mirkwood or the JIT-Thunk Layers
After setting the breakpoint for the click event, allow the program to continue until you see the window, Wilderland, and press the Lonely Mountain
button. The debugger will now stop your program and display:
(I am taking snapshots of the release version of the Wilderland program - you may see something a bit different if you are using the debug version.)
If you are prepared to enter the mysterious forest, Mirkwood, and are willing to follow the magic path, press F10 until you reach the jump statement:
JMP EAX
Note that your local variable, TheOneRing, is present in the register RDX. Also, select the Register Contents window and Edit/Watch Contents of RAX:
Press F10 once and you should be seeing:
PID: 0x0E10 Disassembly for THUNK at 0x000007FE8CC8C040
000007FE8CC8C040: CALL PrecodeFixupThunk
000007FE8CC8C045: POP RSI
000007FE8CC8C046: ADD AL,BYTE PTR [RCX+RBP*8]
000007FE8CC8C049: XOR ESP,DWORD PTR [RDX+0x045F0018]
000007FE8CC8C04F: ADD EBP,EAX
000007FE8CC8C051: MOV EBX,0x5E5F7B60
...
Note the call to PrecodeFixupThunk. Press F11, i.e., step into the call, rather than
F10, stepping over. If by
accident you press F10, the program will continue without an opportunity for further interaction and like the danger in
the river in the middle of Mirkwood, your debugging session will never wakeup (since the following
POP RSI instruction will not be executed).
If you have carefully used the F11 boat like the 13 dwarves and the hobbit, the following will be your reward:
PID: 0x0E10 Disassembly for clr.dll!PrecodeFixupThunk (0x000007FEEC442110)
000007FEEC442110: POP RAX
000007FEEC442111: MOVZX R10,BYTE PTR [RAX+0x02]
000007FEEC442116: MOVZX R11,BYTE PTR [RAX+0x01]
000007FEEC44211B: MOV RAX,QWORD PTR [RAX+R10*8+0x03]
000007FEEC442120: LEA R10,QWORD PTR [RAX+R11*8]
000007FEEC442124: JMP 0x000007FEEC442450
000007FEEC442450: LEA RAX,QWORD PTR [RSP+0x08]
000007FEEC442455: PUSH R10
000007FEEC442457: PUSH R15
000007FEEC442459: PUSH R14
000007FEEC44245B: PUSH R13
000007FEEC44245D: PUSH R12
000007FEEC44245F: PUSH RBP
000007FEEC442460: PUSH RBX
000007FEEC442461: PUSH RSI
000007FEEC442462: PUSH RDI
000007FEEC442463: PUSH RAX
000007FEEC442464: SUB RSP,0x78
000007FEEC442468: MOV QWORD PTR [RSP+0x000000D0],RCX
000007FEEC442470: MOV QWORD PTR [RSP+0x000000D8],RDX
000007FEEC442478: MOV QWORD PTR [RSP+0x000000E0],R8
000007FEEC442480: MOV QWORD PTR [RSP+0x000000E8],R9
000007FEEC442488: MOVQ XMMWORD PTR [RSP+0x20],XMM0
000007FEEC44248E: MOVQ XMMWORD PTR [RSP+0x30],XMM1
000007FEEC442494: MOVQ XMMWORD PTR [RSP+0x40],XMM2
000007FEEC44249A: MOVQ XMMWORD PTR [RSP+0x50],XMM3
000007FEEC4424A0: LEA RCX,QWORD PTR [RSP+0x68]
000007FEEC4424A5: CALL clr.dll!PreStubWorker
000007FEEC4424AA: MOVDQA XMM0,XMMWORD PTR [RSP+0x20]
000007FEEC4424B0: MOVDQA XMM1,XMMWORD PTR [RSP+0x30]
000007FEEC4424B6: MOVDQA XMM2,XMMWORD PTR [RSP+0x40]
000007FEEC4424BC: MOVDQA XMM3,XMMWORD PTR [RSP+0x50]
000007FEEC4424C2: MOV RCX,QWORD PTR [RSP+0x000000D0]
000007FEEC4424CA: MOV RDX,QWORD PTR [RSP+0x000000D8]
000007FEEC4424D2: MOV R8,QWORD PTR [RSP+0x000000E0]
000007FEEC4424DA: MOV R9,QWORD PTR [RSP+0x000000E8]
000007FEEC4424E2: NOP
000007FEEC4424E3: ADD RSP,0x0000000000000080
000007FEEC4424EA: POP RDI
000007FEEC4424EB: POP RSI
000007FEEC4424EC: POP RBX
000007FEEC4424ED: POP RBP
000007FEEC4424EE: POP R12
000007FEEC4424F0: POP R13
000007FEEC4424F2: POP R14
000007FEEC4424F4: POP R15
000007FEEC4424F6: POP R10
000007FEEC4424F8: JMP RAX
Don't be intimidated by all of this assembly code - most of it exists to preserve the state of your managed code, both before the upcoming call to the
JIT compiler and restoring its state after the call. Incidentally, all of the JIT events that appear in the JIT Events window have already passed through this code.
The two most important registers in the Registers window to pay attention to as you single-step through the code are RAX and R10. Also, note the first instruction, i.e., POP RAX. If you think about it and remember the previous instruction, a call statement, you will realize that the call's return address will pop off the stack into the RAX register and that is the address of the instruction after the call! This little trick provides the code with an address inside the thunk memory and helps the following mysterious bit of code load R10 with another thunk address which will become quite important in the upcoming call to the JIT compiler.
Now, press F10 until you reach the call to CLR!PreStubWorker. If you wish to spelunk the internals of the .NET JIT process, you would now step into
this call by pressing F11, but be prepared to face spiders and worse inside this code - it is hairy stuff! Instead, step over the call using
F10 and
observe how the memory window you opened earlier for the RAX register has changed:
The contents for the memory location, e.g., 000007FE8CC8C040, have changed (indicated by the red color)! If you disassemble this address using View/Disassemble At,
you may also observe that the call to PrecodeFixupThunk has now been replaced by a jump statement! The C# code for the private method,
LonelyMountain, has just been compiled and your program granted access to it by this small piece of self-modifying code magic. Continue pressing F10 until
you reach the JMP RAX instruction and then press F10 again:
PID: 0x0E10 Disassembly for THUNK at 0x000007FE8CE16360
000007FE8CE16360: SUB RSP,0x28
000007FE8CE16364: TEST RCX,RCX
000007FE8CE16367: JE 0x000007FE8CE163B2
000007FE8CE16369: MOV RAX,QWORD PTR [RCX]
000007FE8CE1636C: MOV R10D,0x7FFFFF10018
000007FE8CE16376: CMP RAX,R10
000007FE8CE16379: JNE 0x000007FE8CE163B2
000007FE8CE1637B: MOV QWORD PTR [RSP+0x30],RCX
000007FE8CE16380: MOV QWORD PTR [RSP+0x38],RDX
000007FE8CE16385: MOV QWORD PTR [RSP+0x40],R8
000007FE8CE1638A: MOV QWORD PTR [RSP+0x48],R9
000007FE8CE1638F: MOV RAX,QWORD PTR [RCX+0x28]
000007FE8CE16393: MOV RCX,QWORD PTR [RCX+0x10]
000007FE8CE16397: CALL RAX
000007FE8CE16399: MOV RCX,QWORD PTR [RSP+0x30]
000007FE8CE1639E: MOV RDX,QWORD PTR [RSP+0x38]
000007FE8CE163A3: MOV R8,QWORD PTR [RSP+0x40]
000007FE8CE163A8: MOV R9,QWORD PTR [RSP+0x48]
000007FE8CE163AD: TEST RAX,RAX
000007FE8CE163B0: JNE 0x000007FE8CE163C3
000007FE8CE163B2: MOV RAX,0x7FE8CDA0390
000007FE8CE163BC: ADD RSP,0x28
000007FE8CE163C0: JMP RAX
000007FE8CA45BE3: MOV R10D,0x7FE8C8B6560
000007FE8CA45BED: MOV RAX,0x7FEEC0DBCB0
000007FE8CA45BF7: ADD RSP,0x28
000007FE8CA45BFB: JMP RAX
I suspect most of this code exists to support .NET instrumentation and other profiling activities since pressing F10 until the first JMP RAX statement (funny how
this instruction continues to show up) bypasses much of this. (The address, 0x7FEEC0DBCB0, references a routine called TransparentProxyStubRCX inside of CLR.DLL.)
Pressing F10 once more brings us safely to the LonelyMountain private method:
Allowing the program to continue (by pressing F5) will now result in the button's text announcing to the world that we have safely reached our destination:
The Journey Home
We are just about at the end of our adventure, but if you press the newly changed button, Bilbo Lives!, the program will be halted a second time inside the click event
and you can repeat the above steps to see for yourself how the code behaves on subsequent passes. You should note that the program executes the second thunk layer again and will
continue to do so as long as the program is active (or not modified by a re-JIT request or some other injected code). Like Bilbo and the magic ring, our code
is subtly altered by repeated activity.
The more adventurous (Tookish) among you may wish to set a breakpoint on the FormClosing event and travel through a slightly different JIT path when a native routine,
e.g., MessageBox, is invoked.
PID: 0x0E10 Disassembly for Wilderland.exe!
Wilderland::Form1::Form1_FormClosing (06000004) at 0x000007FE8CDA03D0
  ;********************************************************************************
 000007FE8CDA03D0: MOV     RCX,0x12A03238
 000007FE8CDA03DA: MOV     RCX,QWORD PTR [RCX]
 000007FE8CDA03DD: MOV     RDX,0x12A03240
 000007FE8CDA03E7: MOV     RDX,QWORD PTR [RDX]
 000007FE8CDA03EA: LEA     RAX,QWORD PTR [0x000007FEE8920F30]
 000007FE8CDA03F1: JMP     RAX
  ;
  000007FE8CDA03F4: RET
The first thunk is the same; but the second is missing since you are executing NGEN'd code inside of System.Windows.Forms.ni.DLL.
For the rest of us, we can view the last bit of Wilderland:
and declare the adventure over after dismissing the last dialog box.
Conclusion
If you compare the earlier article with this one, you should realize that though the details have changed during the migration from 32-bit, earlier
versions of the Common Language Runtime to its 64-bit successor, the essence is still the same. When your .NET executable is loaded, small stubs pointing to a
common thunk that wraps the JIT compilation process are created for every MethodDef in your code. After successfully compiling the IL for the method,
the JIT compiler allocates memory to hold the new, native instructions and creates a second customized stub linking the original call to the new code. If
you tried traveling the MessageBox path, you will also realize a similar process occurs in linking your code to native Windows APIs. Also I hope that
by introducing you to my new, 64-bit debugger, you will have gained a new tool in your arsenal for exploring and understanding the .NET Wilderland.


