Intel is a leading provider of both hardware and software for datacenter users―such as the latest Intel® Xeon® and Intel® Xeon Phi™ processors. However, many high-performance computing (HPC) applications don’t make full use of the processors’ advanced capabilities. In this article, we’ll provide a step-by-step methodology to improve the performance of SPECFEM3D_GLOBE*, a software package that simulates three-dimensional global and regional seismic wave propagation and performs full waveform imaging (FWI) or adjoint tomography based on the spectral element method (SEM). All SPECFEM3D_GLOBE software is written in Fortran* 2003 with full portability in mind, and conforms strictly to the 2003 standard. The package uses the Message Passing Interface (MPI) to express distributed-memory parallelism. Recently, OpenMP* shared-memory parallel constructs were introduced in the solver source code.
Follow these steps to quickly get started building and running this code:
$ cd specfem3d_globe
$ ./configure FC=ifort MPIFC=mpiifort CC=icc CXX=icpc FCFLAGS="-O3 -xMIC-AVX512 -qopenmp"
$ cp EXAMPLES/small_benchmark_run_to_test_more_complex_Earth/Par_file DATA
$ make -j 8 xcreate_header_file xmeshfem3D xspecfem3D
$ cd EXAMPLES/small_benchmark_run_to_test_more_complex_Earth
$ ./run_this_example.sh
Notes
- Download SPECFEM3D_GLOBE from https://geodynamics.org/cig/software/specfem3d_globe/.
- The test benchmark being executed is small_benchmark_run_to_test_more_complex_Earth in the EXAMPLES directory.
- The Intel® compilers and MPI library are used for this build. Hence, the ‘icc’, ‘icpc’, ‘ifort’, and ‘mpiifort’ configuration options.
- The build/run machine contains Intel Xeon Phi (Knights Landing) processors so the compiler flag ‘-xMIC-AVX512’ is used.
- The ‘-qopenmp’ flag builds the package with OpenMP threads enabled.
- Performance of the solver code is measured by the time taken to simulate ‘n"’time-steps for a given mesh volume.
- The steps to edit model resolution, parameters, and number of MPI processes are available in the SPECFEM3D_GLOBE documentation.
Assuming that the solver ran successfully, we need to know if it executed efficiently, making the best use of the resources available. A profile of the runtime execution will give us a sneak peek at the time spent in various subroutines of the solver code. We can collect such a profile across multiple cluster nodes to monitor MPI behavior plus each node’s execution statistics. Tools like Intel® MPI Performance Snapshot and Intel® Trace Analyzer and Collector have features to collect an MPI execution profile. In addition, single-node profiles can be collected using Intel® VTune™ Amplifier and Intel® Advisor. SPECFEM3D_GLOBE has excellent MPI scalability with its asynchronous MPI communication/computation overlap, so our focus will be on per-node application profiling and optimization.
A general exploration profile collected using Intel VTune Amplifier shows that this code is backend-bound with further classification showing it has a memory (DRAM) latency issue. The summary view of general exploration is shown in Figure 1. Drilling down to hotspots and then the source code gives us the profile shown in Figure 2. The etax arrays, accessed in the compute_element_iso subroutine, have a dimension of 125 x N. The INDEX_IJK increments from 1 to 125 and the index ispec is arbitrary—hence, an indirect access. Tools such as Intel Advisor give you insight into the randomness of this access and also vectorization of the code (compiler generated). Figure 3 shows such a profile.
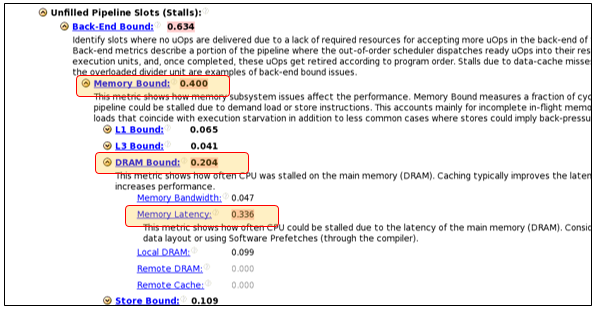
1. Intel® VTune™ Amplifier general exploration

2. Intel VTune Amplifier drill-down showing hotspots, source code
3. Intel Advisor: Unit/random stride distribution, source drill-down, vector intensity/code-generated
Intel Advisor shows information about memory access strides―including whether they are unit, random, or fixed stride―and their distribution. Also, it gives information about compiler code generation and the vector length used for a loop execution, the instruction set, and vectorization gain. This profile helps determine if an application benefits from the vector features and the newer instructions in the processor. Sometimes, a loop may be vectorized by the compiler to utilize the full vector width of the processor (e.g., AVX-512*) but a corresponding speedup in the loop execution isn’t observed. One reason could be that it is bandwidth-limited. Intel VTune Amplifier allows for such a profiling (Figure 4). It’s important to understand that optimizations to improve vector performance of loops that are bandwidth-bound (high utilization) will be less fruitful. The low-bandwidth utilization loops and code regions could be executing non-vector instructions and/or suffering from memory access latency issues. This needs to be fixed.
After analyzing the execution profile of SPECFEM3D_GLOBE, we attempted some code changes to improve performance on Intel® processors.
4. Intel VTune Amplifier memory bandwidth analysis
Mitigate Memory Access Latency Issues
An indirect (random) access was transformed into a unit-stride access. Much of the mesh data in the SPECFEM3D_GLOBE solver is invariant over time/solver steps. Hence, it is a valid transformation to copy data and make it a linear access.
subroutine compute_element_tiso(ispec,
...
    c13 = 0.125_CUSTOM_REAL*cosphisq*(rhovphsq + six_eta_aniso*rhovphsq \
...
prepare_timerun (...)
...
    do ispec_p = 1,num_elements
      ele_num = ele_num + 1
...
          ia_c1store(idx6+3,tiso_ele_num) = c13
---------------------------------------------------------------
subroutine compute_element_tiso(ispec, ele_num, &
...
    c13 = ia_c1store(idx7+3,tiso_ele_num)
...
This code modification copies all nine arrays—’xix,’ ‘xiy … gammzl’—into one array, ‘ia_arr’. This will help alleviate bandwidth pressure for these accesses (because only one array access needs to be done (instead of nine) but is less vector-friendly (because the elements of each array aren’t contiguous). For cases where bandwidth pressure isn’t much of a concern, a user can create nine arrays corresponding to the original code and get vectorization benefit. The best option must be determined by experiment.
Compiler Vectorization/Loop Fission
The compute loops ‘iso’ and ‘tiso’ are huge. The compiler is unable to vectorize these loops. So, a manual loop fission was done. A similar effect can be realized by using ‘!DIR$ DISTRIBUTE POINT’ syntax supported by Intel® compilers for loop distribution/fission.
Data Alignment/Padding
The compute loops ‘iso’ and ‘tiso’ are invoked for each element in the mesh and are invoked from either an MPI or a thread region. These loops have trip count of 125. Since the arrays accessed in the loop have the dimensions 125 x N, another optimization applied to this code was to make it aligned to a 2n boundary. A padding of three elements was applied to make it a 128 x N array.
subroutine compute_element_tiso(ispec,
...
    c13 = 0.125_CUSTOM_REAL*cosphisq*(rhovphsq + six_eta_aniso*rhovphsq \
...
prepare_timerun (...)
...
    do ispec_p = 1,num_elements
      ele_num = ele_num + 1
...
          ia_c1store(idx6+3,tiso_ele_num) = c13
---------------------------------------------------------------
subroutine compute_element_tiso(ispec, ele_num, &
...
    c13 = ia_c1store(idx7+3,tiso_ele_num)
...
Replace Redundant Computation with Lookup Tables
The ‘tiso’ loop has some computations that invoke transcendental functions. These computations are invariant with solver execution time-steps. The same can be replaced with lookup tables.
IVDEP or SIMD Directives
Some hotspots in the SPECFEM3D_GLOBE solver are nested loops with trip counts 5 x 5 and 5 x 25. These are ‘m x m’ matrix-matrix multiplications. The compiler optimization reports (use -qopt-report flag) indicated that not all these loops were vectorized. Using IVDEP or SIMD directives helped the compiler to generate vector code for these loops.
In conclusion, some simple code changes (and data transformations) improved the performance of SPECFEM3D_GLOBE solver by approximately 2.1X on an Intel Xeon Phi processor-based system. There’s room for further optimization—and it’s being explored.
Configuration and Tools Used
- Intel Parallel Studio XE 2017
- Self-boot system with Intel Xeon Phi 7250 processor, 96GB DDR memory
- MCDRAM on Intel Xeon Phi processor configured to FLAT mode. Mesh interconnect in QUAD mode.
- OS version: CentOS* Linux* release 7.3.1611 (kernel 3.10.0-514.10.2.el7.x86_64, glibc 2.17-157.el7_3.1.x86_64)
References
- # SPECFEM3D_GLOBE: Komatitsch and Tromp 1999; Komatitsch and Vilotte (1998): https://geodynamics.org/cig/software/specfem3d_globe/
- Intel Software tools/manuals: https://software.intel.com/en-us/intel-parallel-studio-xe
- Intel® 64 and IA-32 Architectures Software Developer Manuals: https://software.intel.com/en-us/articles/intel-sdm
- Ahmad Yasin. "A Top-Down Method for Performance Analysis and Counters Architecture." IEEE Xplore: 26 June 2014. Electronic ISBN: 978-1-4799-3606-9.
Rama Kishan Malladi is a technical marketing engineer in the Software and Services Group at Intel Corporation.


