Click here for a free trial software download
Kevin O’Leary, Technical Consulting Engineer; Ilyas Gazizov, Senior Software Developer; Alexandra Shinsel, Technical Consulting Engineer; Roman Belenov, Senior Software Developer; Zakhar Matveev, Product Architect; and Dmitry Petunin, Technical Consulting Engineer, Intel Corporation
Software must be both threaded and vectorized to fully utilize today’s and tomorrow’s hardware. Data-driven vectorization design can yield long-term performance growth with less risk and more impact. Even with perfect vector and thread parallelism, developers often have to additionally balance CPU/vector/thread utilization versus memory subsystem data bottlenecks. This aspect of optimization could often be addressed by using a roofline "bounds and bottlenecks" performance model.
This article provides an overview of Intel® Advisor 2017 and discusses the new Intel Advisor Roofline Analysis feature. The roofline model provides an intuitive and powerful representation of how to best address performance issues in your application. Finally, a case study shows the optimization process on a real example.
Roofline Model
Roofline modeling was first proposed by University of California at Berkeley researchers Samuel Williams, Andrew Waterman, and David Patterson in the paper Roofline: An Insightful Visual Performance Model for Multicore Architectures in 2009. Recently, it was extended to address all levels of the memory subsystem, as described by Aleksandar Ilic, Frederico Pratas, and Leonel Sousa in their Cache-Aware Roofline Model: Upgrading the Loft paper.
A roofline model provides insight into how your application works by helping you answer these questions:
- Does my application work optimally on the current hardware? If not, what is the most underutilized hardware resource?
- What limits performance? Is my application workload memory or compute bound?
- What is the right strategy to improve application performance?
The model plots data to help you visualize application compute and memory bandwidth ceilings by measuring two parameters:
- Arithmetic intensity, the number of floating-point operations per byte transferred between CPU and memory
- Floating-point performance measured in billions of floating-point operations per second (GFLOPS)
The proximity of the data points to the model lines (rooflines) shows the degree of optimization (Figure 1). The kernels on the right-hand side, in the blue region, are more compute bound. As you move up the Y axis, they get close to the floating-point peak. The performance of these kernels is bounded by the compute capabilities of the platform. To improve the performance of kernel 3, consider migrating this kernel to a highly parallel platform, such as the Intel® Xeon Phi™ processor, where the compute ceiling and memory throughput are higher. For kernel 2, vectorization can be considered as a performance improvement strategy, since it is far away from the ceiling.
Toward the left-hand side of the plot, in the red region, the kernels are memory bound. As you move up the Y axis, they are limited by the DRAM and cache peak bandwidth of the platform. To increase the performance of these kernels, consider improving the algorithm or its implementation to perform more computations per data item, thereby shifting the plot position to the right, where the performance ceiling is higher. These kernels may also run faster on an Intel Xeon Phi processor because of the higher memory bandwidth.
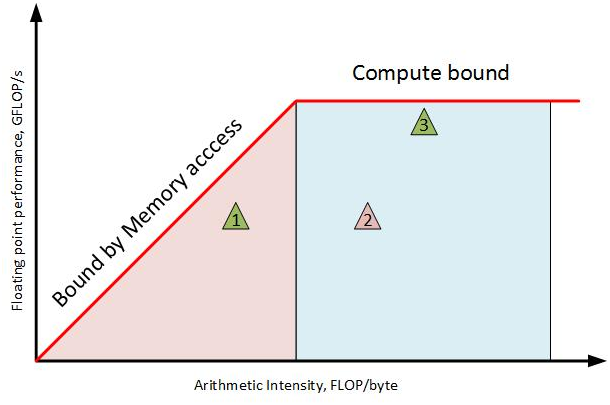
Figure 1. Roofline chart
Intel Advisor Overview
Intel Advisor is a software analysis tool offering a powerful software design and performance characterization platform for applications. Intel Advisor incorporates thread parallelism prototyping (Threading Advisor), vector parallelism optimization (Vectorization Advisor), and memory-versus-compute characterization (Advisor Roofline Automation) capabilities.
In this article, we mainly focus on the Advisor Roofline and Vectorization analyses. When using the Intel Advisor GUI, you can switch between Vectorization and Threading Advisor flows using the "Workflow" toggle. The Roofline chart can be accessed by using the Roofline sidebar (Figure 2).

Figure 2. Intel® Advisor workflow selector
Vectorization Advisor can help you increase the performance of your code using these steps:
- Survey shows which loops consume the most time with detailed SIMD statics.
- FLOPS and Trip Counts measure iteration counts, call counts, and the precise number of floating-point operations per second for each loop and function.
- Recommendations gives specific advice on how to fix performance issues.
- Dependencies Analysis provides a dynamic dependency analysis to verify if a loop has cross-iteration dependencies that can limit vectorization and parallelization.
- Memory Access Patterns Analysis checks if you are accessing memory in a vector-friendly manner.
You can discover many important performance and design insights by combining Vectorization Advisor and Roofline analyses. For example, knowing the Vectorization Efficiency metric provided by the Vectorization Advisor Survey Report is often crucial when interpreting the data on a roofline chart.
Intel Advisor Roofline Analysis
Intel Advisor implements the "cache-aware" flavor of the roofline model, which provides additional insight by addressing all levels of memory/cache hierarchy:
- Sloped rooflines illustrate peak performance levels if all the data fits into the respective cache.
- Horizontal lines show the peak achievable performance levels if vectorization and other CPU resources are used effectively.
Intel Advisor places a dot for every loop in the roofline plot (Figure 3). The circle sizes and colors denote the relative execution time of the loops. Most of the loops require further optimizations to better utilize cache memory. Some, such as the green dot sitting on the dotted ScalarAddPeak line, just to the right of the vertical line in the middle, may be a loop that is poorly vectorized. As you can see, the roofline chart makes it easy to locate opportunities to improve application performance.
Figure 3. Intel® Advisor roofline chart with source tab
How to Interpret the Intel Advisor Roofline Chart
A roofline plot provides useful information but is not a reference table, in which one simply locates their input and reads the corresponding output. It is a guide that suggests what factors to investigate. It requires interpretation.
The lines on a roofline chart, such as the ones in Figure 3, are representative of hardware limits on kernel performance based on benchmarks run by Intel Advisor to establish baselines and performance limits on the host system. The uppermost lines form the roofs that are representative of the maximum performance of the machine. In Figure 3, the uppermost lines are "L1 Bandwidth" and "Single Vector FMA Peak." Not every kernel can achieve this performance and may be ultimately limited by lower roofs, depending on the nature of the algorithm (e.g., a kernel that cannot be vectorized would be limited by the maximum performance of scalar computations).
A kernel’s horizontal position on the plot is its arithmetic intensity (the number of floating-point operations per byte transferred between CPU and memory, as measured by operand size), which is primarily determined by its algorithm, though this can be altered somewhat by optimizations that occur during compilation. Figure 4 gives examples of different algorithms and their relative arithmetic intensities. Redesigning a kernel’s algorithm to increase its arithmetic intensity pushes it to the right in the roofline chart, which may be helpful in raising its maximum potential performance, due to the slopes of the memory bandwidth roofs.
Figure 4. Arithmetic Intensity
A kernel’s vertical position relative to the various roofs reveals bottlenecks. If a kernel is placed above a roof, then that roof is not the primary performance bottleneck, although it can still affect performance. The roofs above a kernel are potential bottlenecks, each corresponding to an issue that can be overcome using a particular type of optimization. If a kernel is below the scalar computation peak line, then it is worth investigating the kernel’s vectorization status. If it is unvectorized, or inefficiently vectorized, it is likely that this roof represents the bottleneck and suggests that it would be prudent to improve or implement the kernel’s vectorization if possible. If, on the other hand, this kernel is efficiently vectorized, the scalar computation peak can be ruled out as a bottleneck, and you can move on to investigating the other roofs above the kernel.
Solving Performance Problems Using Intel Advisor
Some Intel Advisor tips are provided in this section.
Tip No. 1: Use the summary view to see the top time-consuming loops (Figures 5 and 6) and tuning recommendations (Figure 7).
Figure 5. Summary of top loops
Figure 6. Summary of top loops with top loop vectorized
Figure 7. Summary of top recommendations
Tip No. 2: Use roofline customization to remove the roofs you don’t need (Figure 8).
For example, if you are operating on only single-precision data, you can safely remove the double-precision peaks from your roofline.
Figure 8. Intel® Advisor roofline chart customization
Tip No. 3: Use Smart Mode to find the best optimization candidates (Figure 9).
Loops are ordered on the roofline by their Elapsed Self Time, but by activating Smart Mode, you can identify loops that have high total time. The more total time that is spent in a loop, the larger the overall effect of optimizing it can be.
Figure 9a. Intel® Advisor Smart Mode selector
Figure 9b. Intel® Advisor roofline chart filtered using Smart Mode
Tip No. 4: Use some of the other Intel Advisor features to supplement the information in the roofline chart.
Vectorization efficiency is your vectorization thermometer (Figures 10 and 11). Under Instruction Set Analysis, look at the Traits column to see factors that could be affecting vectorization (Figure 10). Consider running the Intel Advisor memory access pattern collection if you suspect you’re referencing memory in a non-vector-friendly fashion. [Editor’s note: Vladimir Tsymbal’s article "Identifying Scalability Problems in Parallel Applications on Multicore Systems" in this issue of The Parallel Universe magazine describes some techniques to analyze memory access.]
Figure 10. Intel® Advisor survey highlighting vectorization efficiency
Figure 11. Intel® Advisor Vectorized Efficiency explanation
Tip No. 5: Isolate vectorized from nonvectorized loops using the loop toggle (Figure 12).
Figure 12. Intel® Advisor Vectorized/Not Vectorized loop selector
Tip No. 6: Use the source window together with the roofline chart (Figure 13).
Intel Advisor seamlessly integrates your source code into the performance profile.
Figure 13. Intel® Advisor roofline chart highlighting source integration
Case Study: Using Roofline Analysis to Tune an MRI Image Reconstruction Benchmark
The 514.pomriq SPEC ACCEL Benchmark is an MRI image reconstruction kernel described in Stone et al. (2008). MRI image reconstruction is a conversion from sampled radio responses to magnetic field gradients. The sample coordinates are in the space of magnetic field gradients, or K-space. The Q matrix in the MRI image reconstruction is a precomputable value based on the sampling trajectory, the plan of how points in K-space will be sampled. The algorithm examines a large set of input, representing the intended MRI scanning trajectory and the points that will be sampled. Each element of the Q matrix is computed by a summation of contributions from all trajectory sample points. Each contribution involves a three-element vector dot product of the input and output 3-D location plus a few trigonometric operations. The output Q elements are complex numbers but the inputs are multielement vectors. The kernel is fundamentally compute bound because trigonometric functions are expensive, and the regularity of the problem allows for easy management of memory bandwidth. Therefore, once tiling and data layout remove any artificial memory bandwidth bottleneck, the most important optimizations are low-level sequential code optimizations and improving the instruction stream efficiency, such as loop unrolling.
The input to 514.pomriq consists of one file containing the number of K-space values; the number of X-space values; and the list of K-space coordinates, X-space coordinates, and Phi-field complex values for the K-space samples. Each set of coordinates and the complex values are stored as arrays with each field written contiguously. The 514.pomriq output consists of the resulting Q matrix of complex values in "real, imaginary" format for each line. This case study will analyze the 514.pomriq compute kernel and focus on its optimization. The Intel Advisor summary for 514.pomriq run on an Intel Xeon Phi 7250 processor is shown in Figure 14, where it is easy to see that loops involved in computing the Q matrix are the hotspot.
Figure 14. Intel® Advisor summary view
We use Intel Advisor Smart Mode to narrow down the best optimization candidates (Figure 15a). The loop where we are spending the most time is vectorized, but it is still below the MCDRAM roof (Figure 15b). This possibly indicates issues with memory use. Let’s examine the loop using Code Analytics and Recommendations.
Figure 15a. Intel® Advisor smart mode selector
Figure 15b. Intel® Advisor roofline chart filtered using smart mode
Figure 16. Intel® Advisor Code Analytics tab highlighting gathers
We can see heavy gather instructions here and advice to explore the memory access pattern of the loop (Figures 16 and 17). After running a memory access pattern analysis, we observe a 4 percent gather stride, which gives us a tip as to where there might be the potential bottleneck: nonoptimal memory access (Figure 18). After looking at the details, we can verify that there is no need to use gather instructions since the stride is constant (Figure 19a). We can also see the same in the Intel Advisor recommendations (Figure 19b).
Figure 17. Intel® Advisor memory access patterns recommendation
Figure 18. Intel® Advisor Memory Access Patterns Report
Figure 19a. Intel® Advisor Memory Access Pattern Report details
Figure 19b. Intel® Advisor gather/scatter recommendation
Everything becomes clear after checking the source code of the kernel:
#pragma omp simd private(expArg, cosArg, sinArg) reduction(+:QrSum, QiSum)
      for (indexK = 0; indexK < numK; indexK++) {
        expArg = PIx2 * (kVals[indexK].Kx * x[indexX] +
        kVals[indexK].Ky * y[indexX] +
        kVals[indexK].Kz * z[indexX]);

        cosArg = cosf(expArg);
        sinArg = sinf(expArg);

        float phi = kVals[indexK].PhiMag;
        QrSum += phi * cosArg;
        QiSum += phi * sinArg;
      }
Figure 20. Source code of the rate-limiting kernel
The code uses an array of structures, which become "gathers" after vectorization. However, newer versions of the Intel® compiler can recognize the access pattern and apply optimizations to get rid of gathers in order to use more lightweight instructions. "Gathers" replacement is performed by the "Gather to Shuffle/Permutes" compiler transformation and can often be profitable on modern CPUs, especially on platforms with Intel AVX-512 support. [Editor's note: Martyn Corden’s article "Vectorization Opportunities for Improved Performance with Intel® AVX-512" in this issue of The Parallel Universe magazine describes how the Intel® Compiler 2017 takes advantage of Intel AVX-512 to create new opportunities for loop vectorization.]
Let’s take a look at the roofline after recompilation using the new Intel compiler (e.g., Intel Compiler 2017 Update 1) with "Gather to Shuffle/Permutes" support. We can see that the dot is above MCDRAM now, and there are no gather instructions (replaced with Intel AVX-512 "2-source permutes"), as well as an increased number of floating-point operations per second (Figures 21 and 22).
Figure 21. Intel® Advisor roofline chart showing loop now above MCDRAM bandwidth
Figure 22. Intel® Advisor Code Analytics tab
However, there is a more effective way to resolve such issues: AOS (array of structures) to SOA (structure of arrays) conversion. This optimization allows us to use more convenient data containers to improve efficiency during vector processing. In the past, it involved manually reworking the underlying data structures. Now, using the Intel® SIMD Data Layout Templates library (Figure 23), we can simply improve the performance by adding a few lines of code where the kValues structure is declared, where the structure is initialized, and where the K-values are computed.
#include <sdlt/sdlt.h>
struct kValues {
  float Kx;
  float Ky;
  float Kz;
  float PhiMag;
};

SDLT_PRIMITIVE(kValues, Kx, Ky, Kz, PhiMag)


sdlt::soa1d_container<kValues> inputKValues(numK);
auto kValues = inputKValues.access();

  for (k = 0; k < numK; k++) {
    kValues [k].Kx() = kx[k];
    kValues [k].Ky() = ky[k];
    kValues [k].Kz() = kz[k];
    kValues [k].PhiMag() = phiMag[k];
  }


auto kVals = inputKValues.const_access();
#pragma omp simd private(expArg, cosArg, sinArg) reduction(+:QrSum, QiSum)
      for (indexK = 0; indexK < numK; indexK++) {
        expArg = PIx2 * (kVals[indexK].Kx() * x[indexX] +
        kVals[indexK].Ky() * y[indexX] +
        kVals[indexK].Kz() * z[indexX]);

        cosArg = cosf(expArg);
        sinArg = sinf(expArg);

        float phi = kVals[indexK].PhiMag();
        QrSum += phi * cosArg;
        QiSum += phi * sinArg;
      }
Figure 23. Using the SIMD Data Layout Templates library
Let’s check the new roofline chart (Figure 24). After applying this optimization, the dot is no longer red. This means it takes less time now, and it has more GFLOPS, putting it close to the L2 roof. Additionally, the loop now has unit stride access and, as a result, no special memory manipulations (Figures 25a and 25b). The total performance improvement is almost 3x for the kernel and 50 percent for the entire application.
Figure 24. Intel® Advisor final optimized roofline chart
Figure 25a. Intel® Advisor final optimized Memory Access Patterns Report
Figure 25b. Intel® Advisor final optimized Code Analytics tab
Conclusion
The roofline model provides a new, visually intuitive, and powerful representation of your application’s performance. By using the proper optimization techniques, as indicated by the region of the roofline chart your application is in, you can avoid wasting valuable time on optimizations that will have minimal impact on your performance. The roofline model can answer the following questions:
- Can I get better performance?
- What are the key performance bottlenecks: memory or CPU?
- How much speedup can I get if I optimize a particular bottleneck?
- How much speedup can I get if I use another platform?
As systems get bigger and more complex, getting these answers is nontrivial, but roofline analysis can save you time and effort.
Modernize Your Code
- To get the most out of your hardware, you need to modernize your code with vectorization and threading.
- Taking a methodical approach such as the one outlined in this article, and taking advantage of the powerful tools in Intel® Parallel Studio XE can make the modernization task dramatically easier.
- Use Intel Advisor roofline analysis, now available in Intel® Parallel Studio XE 2017 Update 1.
- Send an email to vector_advisor@intel.com to get the latest information on some exciting new capabilities that are currently under development.
Useful Intel Advisor Links
Get started with the Intel® Advisor roofline feature
Selftime-based FLOPS computing with an important explanation of how to interpret roofline results for nested loops
Analyzing MPI applications with Intel Advisor
References
Stone, S. S.; J. P. Haldar, S. C. Tsao, W. W. Hwu., Z. Liang, and B. P. Sutton. "Accelerating advanced MRI reconstructions on GPUs." In International Conference on Computing Frontiers, pages 261–272, 2008.
Try Intel® Advisor, part of Intel® Parallel Studio XE
You may know us for our processors. But we do so much more. Intel invents at the boundaries of technology to make amazing experiences possible for business and society, and for every person on Earth.
Harnessing the capability of the cloud, the ubiquity of the Internet of Things, the latest advances in memory and programmable solutions, and the promise of always-on 5G connectivity, Intel is disrupting industries and solving global challenges. Leading on policy, diversity, inclusion, education and sustainability, we create value for our stockholders, customers and society.


