I was recently involved on a project made with Xamarin. This new mobile app is not released yet, but it’s on a good track and I’m satisfied of the result. The initial objective was to create several Xamarin apps (Brands x Areas on Android + iOS) with an important focus on code sharing & quality. I can’t talk too much on the software architecture but it’s built with MvvmCross.
This article targets Xamarin for Android (aka MonoDroid) only. I hope to find the time to write the same kind of article for iOS, but most of things listed here are pertinent for both platforms.
Watch out network requests
The primary data source for the app are public web apis. These days, it’s a fairly common architecture for a mobile application but don’t forget that latency on mobile networks matters. On a mobile network, we can’t really expect to get the response in less than 100 ms like on desktop browsers. To illustrate this, we’ve simply generated trace messages on every HTTP request ! (url, headers, and sometimes content) It may seem very basic, but it’s terribly important. This helped us to detect duplicated calls, lack of caching, ghost UI controls, duplicated events handlers …
Here are some HTTP logs at app’s startup. Same color = Same uri. Look at the timings, any problem here?
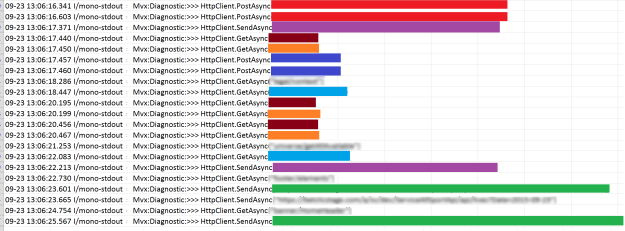 I suggest you enable this kind of logging very early in your project, so everyone will be familiar and educated to mobile latency. Logging all IOs was certainly one of the best idea, but it’s only half of the jjob. To reduce the number of requests you could
- Use Batch requests (combine several calls into a single request) or design your api following “Scenario Driven Design” principles
- Use Abuse local caching, for example with Akavache or Sqlite
- Use modernhttpclient and check gzip compression
- Use pertinent speculative requests and background refreshe
Watch out memory allocation
My team and I am are used to develop server side code (web sites, web apis, workers, ..), running on servers having decent hardware. Unfortunately, you don’t have –yet- that luxury on a mobile app. I don’t think there are limitations but to be clear your app will have to run with only a few MBs. You should be more concerned on memory than ever. There are mainly two problems :
- Excessive allocation adds pressure on GC
Garbage Collection & Memory and Performance Best Practices are must read to understand GC mechanisms on Xamarin. Why GC is so bad ? It just stops all running threads, including the UI thread L. Bye Bye, smooth animations and fast rendering. Minor collections are cheap (only a few ms, sometimes 50 ms) but Major collections are quite slow (from 100 ms to 1 sec). Don’t forget that Major GC collects Gen1 and large object space heaps (LOS). The LOS is where objects that require more than 8000 bytes are kept. 8000 is small, terribly small, especially when you have to consume web apis.
- Memory leak increase major collections and leads to maximum GRefs reached
If you don’t pay attention on memory, your nursery, major heap or LOS will be rapidly full. Since Xamarin.Android 4.1.0, a full -major- GC is performed when a gref threshold is crossed. This threshold is 90% of the known maximum grefs for the platform: 1800 grefs on the emulator (2000 max), and 46800 grefs on hardware (maximum 52000).
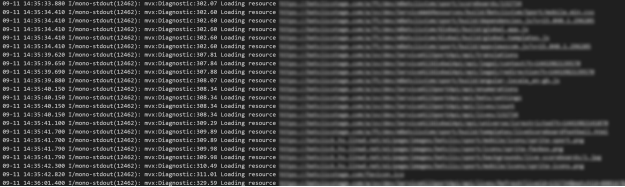
Here are some GC minor messages, visible via logcat. You should always try to understand these messages, and when they happen.
 Observe how the LOS size increases after HttpClient calls, a major GC is expected very soon…
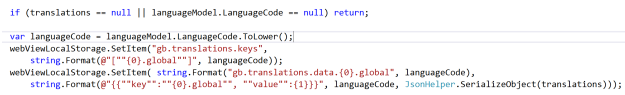
Here is another typical example: Suppose translations contains 2000 items, and that this code is executed on each webview. Failed !
To detect excessive allocation and memory leaks, Android Studio are Xamarin Profiler are great. The produced mlpd file by the last tool can also be opened by Heap-Shot (mono).
Optimize your images
iOS has a built-in image optimization process but not Android. Like for Web performance Optimization, it’s better to have small & optimized images for both the GPU and your app size. Especially on Android, where are there are several folders, it is easy to include hundreds of images.
Many online services are available but you can also use directly pngout/opting for png and jpegtran for jpeg files. Just for your information, 25% was saved of the total assets size.
Note : please be sure to not include useless resources
Optimize your webviews
It’s also very common to have webviews in a mobile app. You can think of the WebView as a chromeless browser window that’s typically configured to run fullscreen. It’s sometimes required to explicitly NOT use native code for some topics (login, registration, content boxes with html, ….) There are two well-known issues with them. First, webviews and their mobile browser counterpart don’t have similar performance profiles (Do u webview ?) ; it’s less accurate since latest versions, but that’s still something to take into account. Second, a webview is often focused on one feature and that’s all. Traditional SPAs has references to all scripts and styles in the main document, leading to a few seconds lost at startup (networks requests, parsing, layout …). That’s a terribly bad idea to integrate an SPA (made with any JS framework), and hope the page to be fully loaded in less than 5 secs. This simply means that your webviews should be optimized for your native app usage.
- Log every request of your webview
- Intercept HTTP requests and sometimes replace response
- Use Javascript interfaces to bootstrap your JS
- Check HTTP caching headers
- Optimize your web resources (js, css, images, …) for a webview usage
Here is what you should AVOID (aka our initial attempt to integrate a SPA into a webview)
Optimize your .NET code and keep your prod build clean
Developers often add debug messages, diagnostics code, local variables … don’t forget to cleanup that kind of code. Here is one of my favorite examples:

string.format and JsonConvert are executed even in a RELEASE build.
I will not talk about Asynchronous programming, which is just mandatory to create a responsive and professional app in 2015 but as a general perf recommendation, try to understand the “hot path” on your app/views. For example, the primary serializer used in this app is Newtonsoft.Json. It’s not the fastest .NET json serializer but certainly the more mature on Xamarin. There are some tips to make it go even faster. Using stream for deserialization is also great to avoid allocation on LOS, because the threshold could be easily reached with json format (see memory section, only 8KB).
Finally, like for any app, keep your production build optimized and clean.
- Use a Release configuration
- Remove dead code, unused variables & classes
- Disable Android debugging
- Review logging & diagnostics
Understand the Android Platform and controls
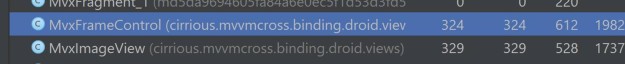
The app may be written in C#, using Mono/Xamarin … but it’s still running on Android. If you are familiar with Windows development, Xaml or WP, please try to forget everything because it’s a completely different platform. Is it better to use a listview or a recyclerview ? How to implement properly a Pager Adapter ? Is my layout optimized ? So yes, you will have to read a lot of articles here but it’s not a waste of time, because it is very close to the –official- Android development. Most of the articles, tips, SO answers that you can read on Android also apply to Xamarin.Android. I’ve already talked about webviews and we’ve done a lot of things that are specific to Android to get the fastest page load. At the middle of the project, a memory leak was identified on a recyclerview. There were simply too many instances of a custom controls.
Our understanding of the inner PagerAdapter was just totally wrong, and we’ve fixed it after reading several SO answers.
Here the main tricks & tips that help me a lot. I wish I knew this at the beginning. My team and I did a lot of codes fixes & fine tuning that are mostly irrelevant without our context, that’s why you have to find your way into Xamarin development. I Hope this will help you.
CodeProject


 General
  News
News  Suggestion
  Question
  Bug
Bug  Answer
  Joke
Joke  Praise
  Rant
Rant  Admin
Admin 


